Introducing RabbitMQ Monitoring
Released on: March 2026Atatus now offers enhanced RabbitMQ monitoring with deeper visibility into your message broker clusters. Monitor queue depth, message throughput, consumer performance, node health, and resource utilization to ensure reliable and efficient message delivery across your applications.
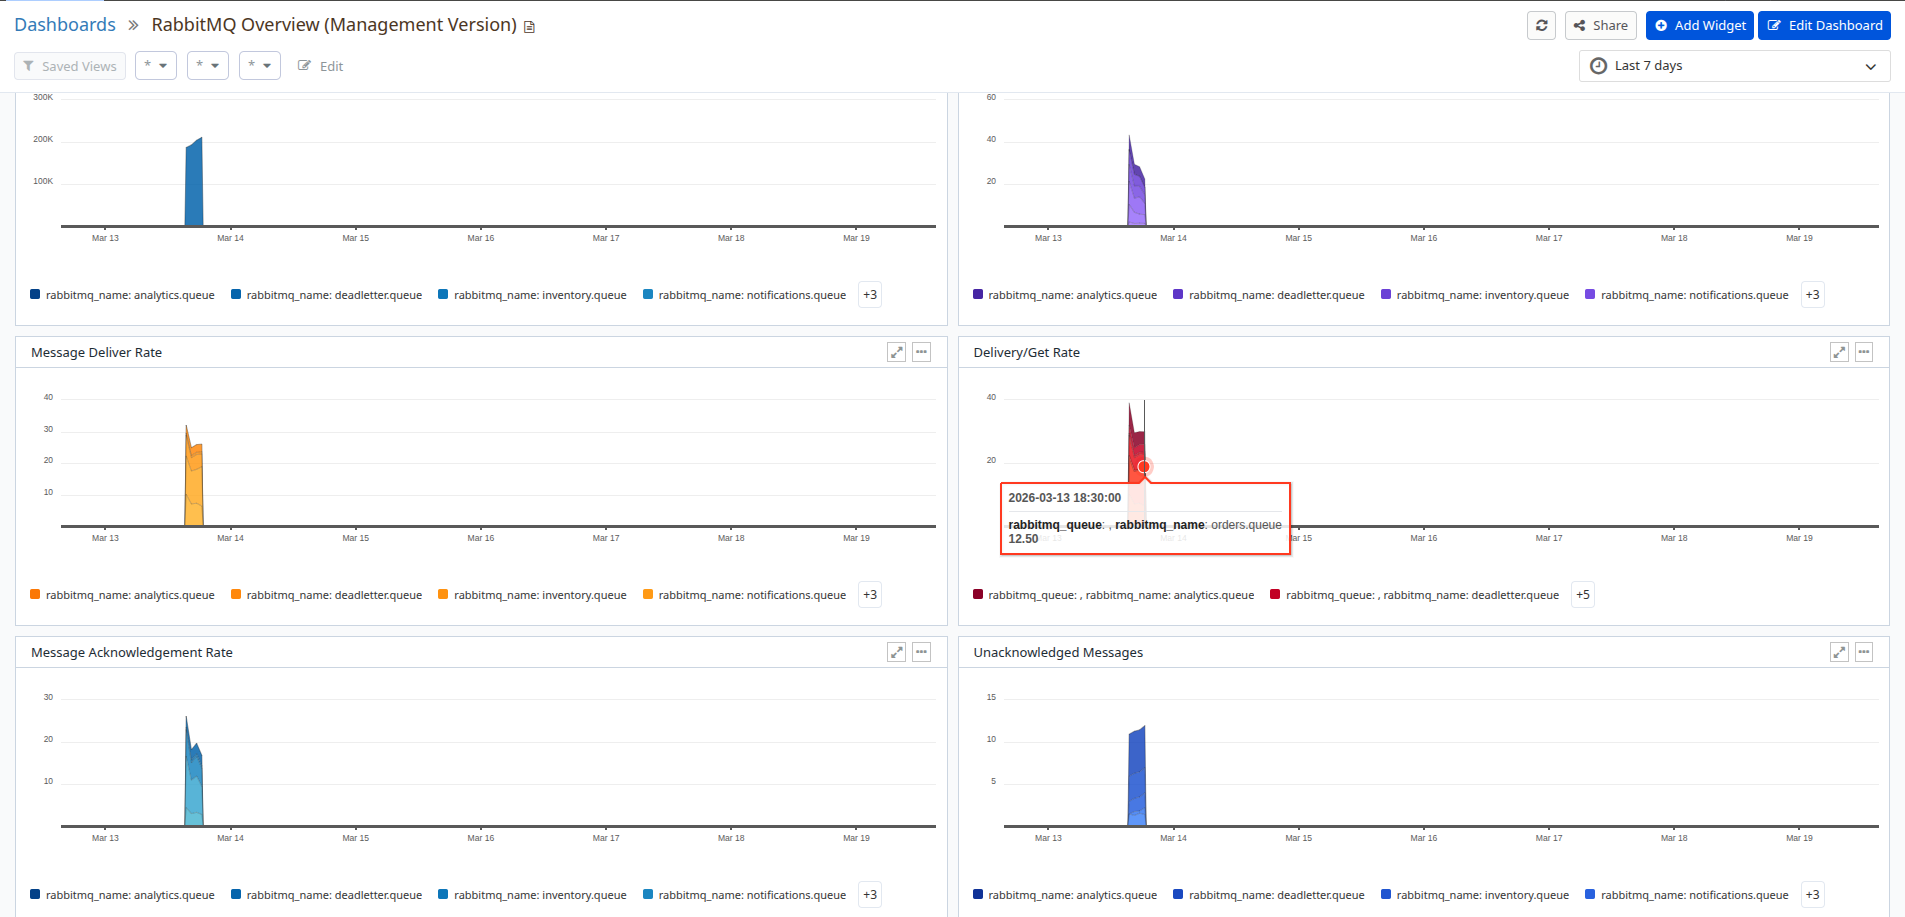
With real-time dashboards and intelligent alerting, DevOps and engineering teams can proactively detect bottlenecks, prevent message backlogs, and maintain high availability in their messaging infrastructure.
Key Benefits of RabbitMQ Monitoring in Atatus:
- Queue Performance Tracking: Monitor queue depth, message rates, consumer counts, and acknowledgment metrics to ensure messages are processed efficiently.
- Node Health Monitoring: Track memory usage, disk space, file descriptors, and Erlang process counts across all nodes in your RabbitMQ cluster.
- Consumer Lag Detection: Identify slow or stalled consumers that may cause message backlogs and impact downstream application performance.
- Connection and Channel Metrics: Monitor active connections, channel counts, and flow control events to detect resource constraints early.
- Cluster-Wide Visibility: Get a unified view of your entire RabbitMQ cluster including inter-node communication, partition detection, and replication status.
Monitor your software stack for free with Atatus.
Start your free trialOR
Request a DemoFree 14-day trial. No credit card required. Cancel anytime.