Introducing Traces and HTTP Failures in PHP APM
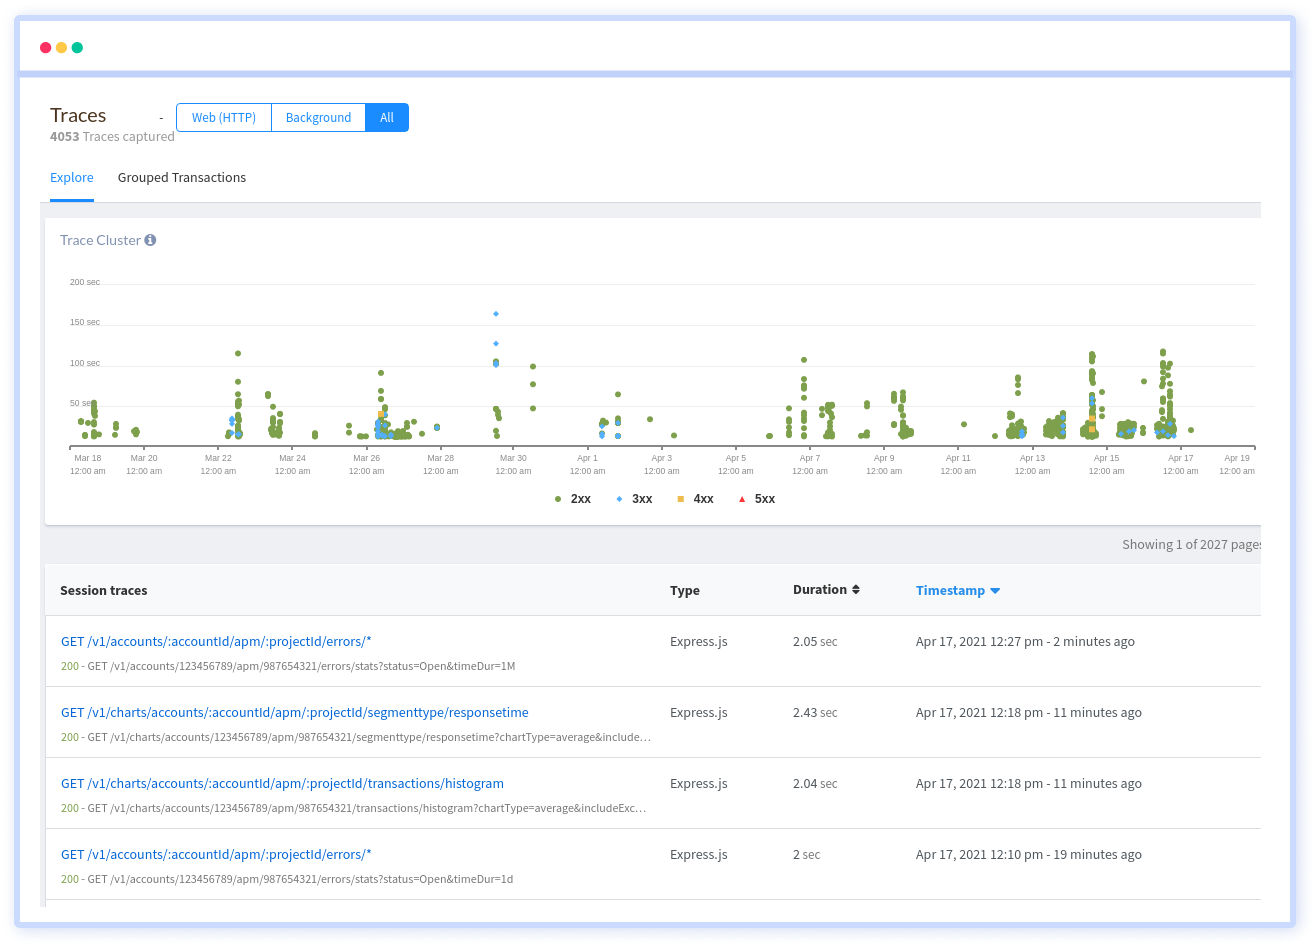
Released on: December 2017In application performance monitoring (APM), transaction traces are detailed recordings of individual transactions as they traverse through the various components of an application's stack. A transaction trace captures the function calls, database queries, and external requests made during a transaction's execution.
Transaction traces serve several important purposes in application monitoring and performance optimization:
- Root Cause Analysis: When a transaction encounters errors or unexpected behavior, transaction traces can help you trace the root cause of the issue by providing a record of the transaction's execution.
- Understanding Transaction Flow: Transaction traces help you understand how transactions flow through your application, including interactions with external services, databases, and third-party APIs.
- Code Efficiency: Transaction traces highlight areas of your code base that contribute most to transaction latency or resource consumption.
- Monitoring Service-Level Agreements (SLAs): Transaction traces help you monitor and enforce service-level agreements by measuring key performance indicators such as response time, throughput, and error rate for individual transactions.
Atatus' HTTP failure request handling feature is useful for several reasons:
- Improved Reliability: Automatically retrying failed HTTP requests or implementing fallback mechanisms helps improve applications' reliability and resilience, reducing the risk of service disruptions and downtime.
- Increased Performance: The feature can help optimize application performance by identifying and addressing issues related to HTTP request failures, such as network latency, server errors, or misconfigurations.
- Error Insights: It provides valuable insights into the root causes of HTTP failures, including error codes, response times, and error rates, facilitating troubleshooting and problem resolution.
- Alerting and Notifications: Atatus' HTTP failure request handling feature can trigger alerts and notifications based on predefined thresholds or anomalies, enabling teams to address issues and prevent service degradation proactively.
Monitor your software stack for free with Atatus.
Start your free trialOR
Request a DemoFree 14-day trial. No credit card required. Cancel anytime.