Backbone Error and Performance Monitoring
Get complete visibility into your Backbone errors and performance issues that are impacting your end user experience. Fix critical issues sooner with in depth data points that helps you in analyzing and resolving issues with great speed.
Gain full visibility into Backbone MVC patterns and real user view rendering in legacy SPAs
Complete Backbone View lifecycle tracking
Monitor view initialization, render cycles, el manipulation, and DOM attachment timing during real user navigation.
Backbone Router URL transitions
Track route matching, view swaps, and hash/fragment navigation delays to identify slow Backbone single page application routing.
Model/Collection sync performance
Measure REST API fetch/parse cycles, model validation overhead, and collection filtering across live traffic patterns.
Backbone runtime error capture
Capture undelegated events, broken model bindings, and view delegation failures with full MVC stack context.
Event delegation responsiveness
Detect slow delegated click handlers, form submissions, and custom Backbone events that stall user interactions.
Model-View-Collection correlation
Trace user actions from Backbone events through model changes to view re-renders and template updates.
jQuery DOM manipulation insights
Analyze Backbone's jQuery-heavy DOM operations, selector performance, and memory leaks across browsers.
Legacy Backbone optimization
Prioritize fixes for zombie views, memory leaks, and event cleanup issues affecting long-running Backbone applications.
View Rendering and DOM Update Execution
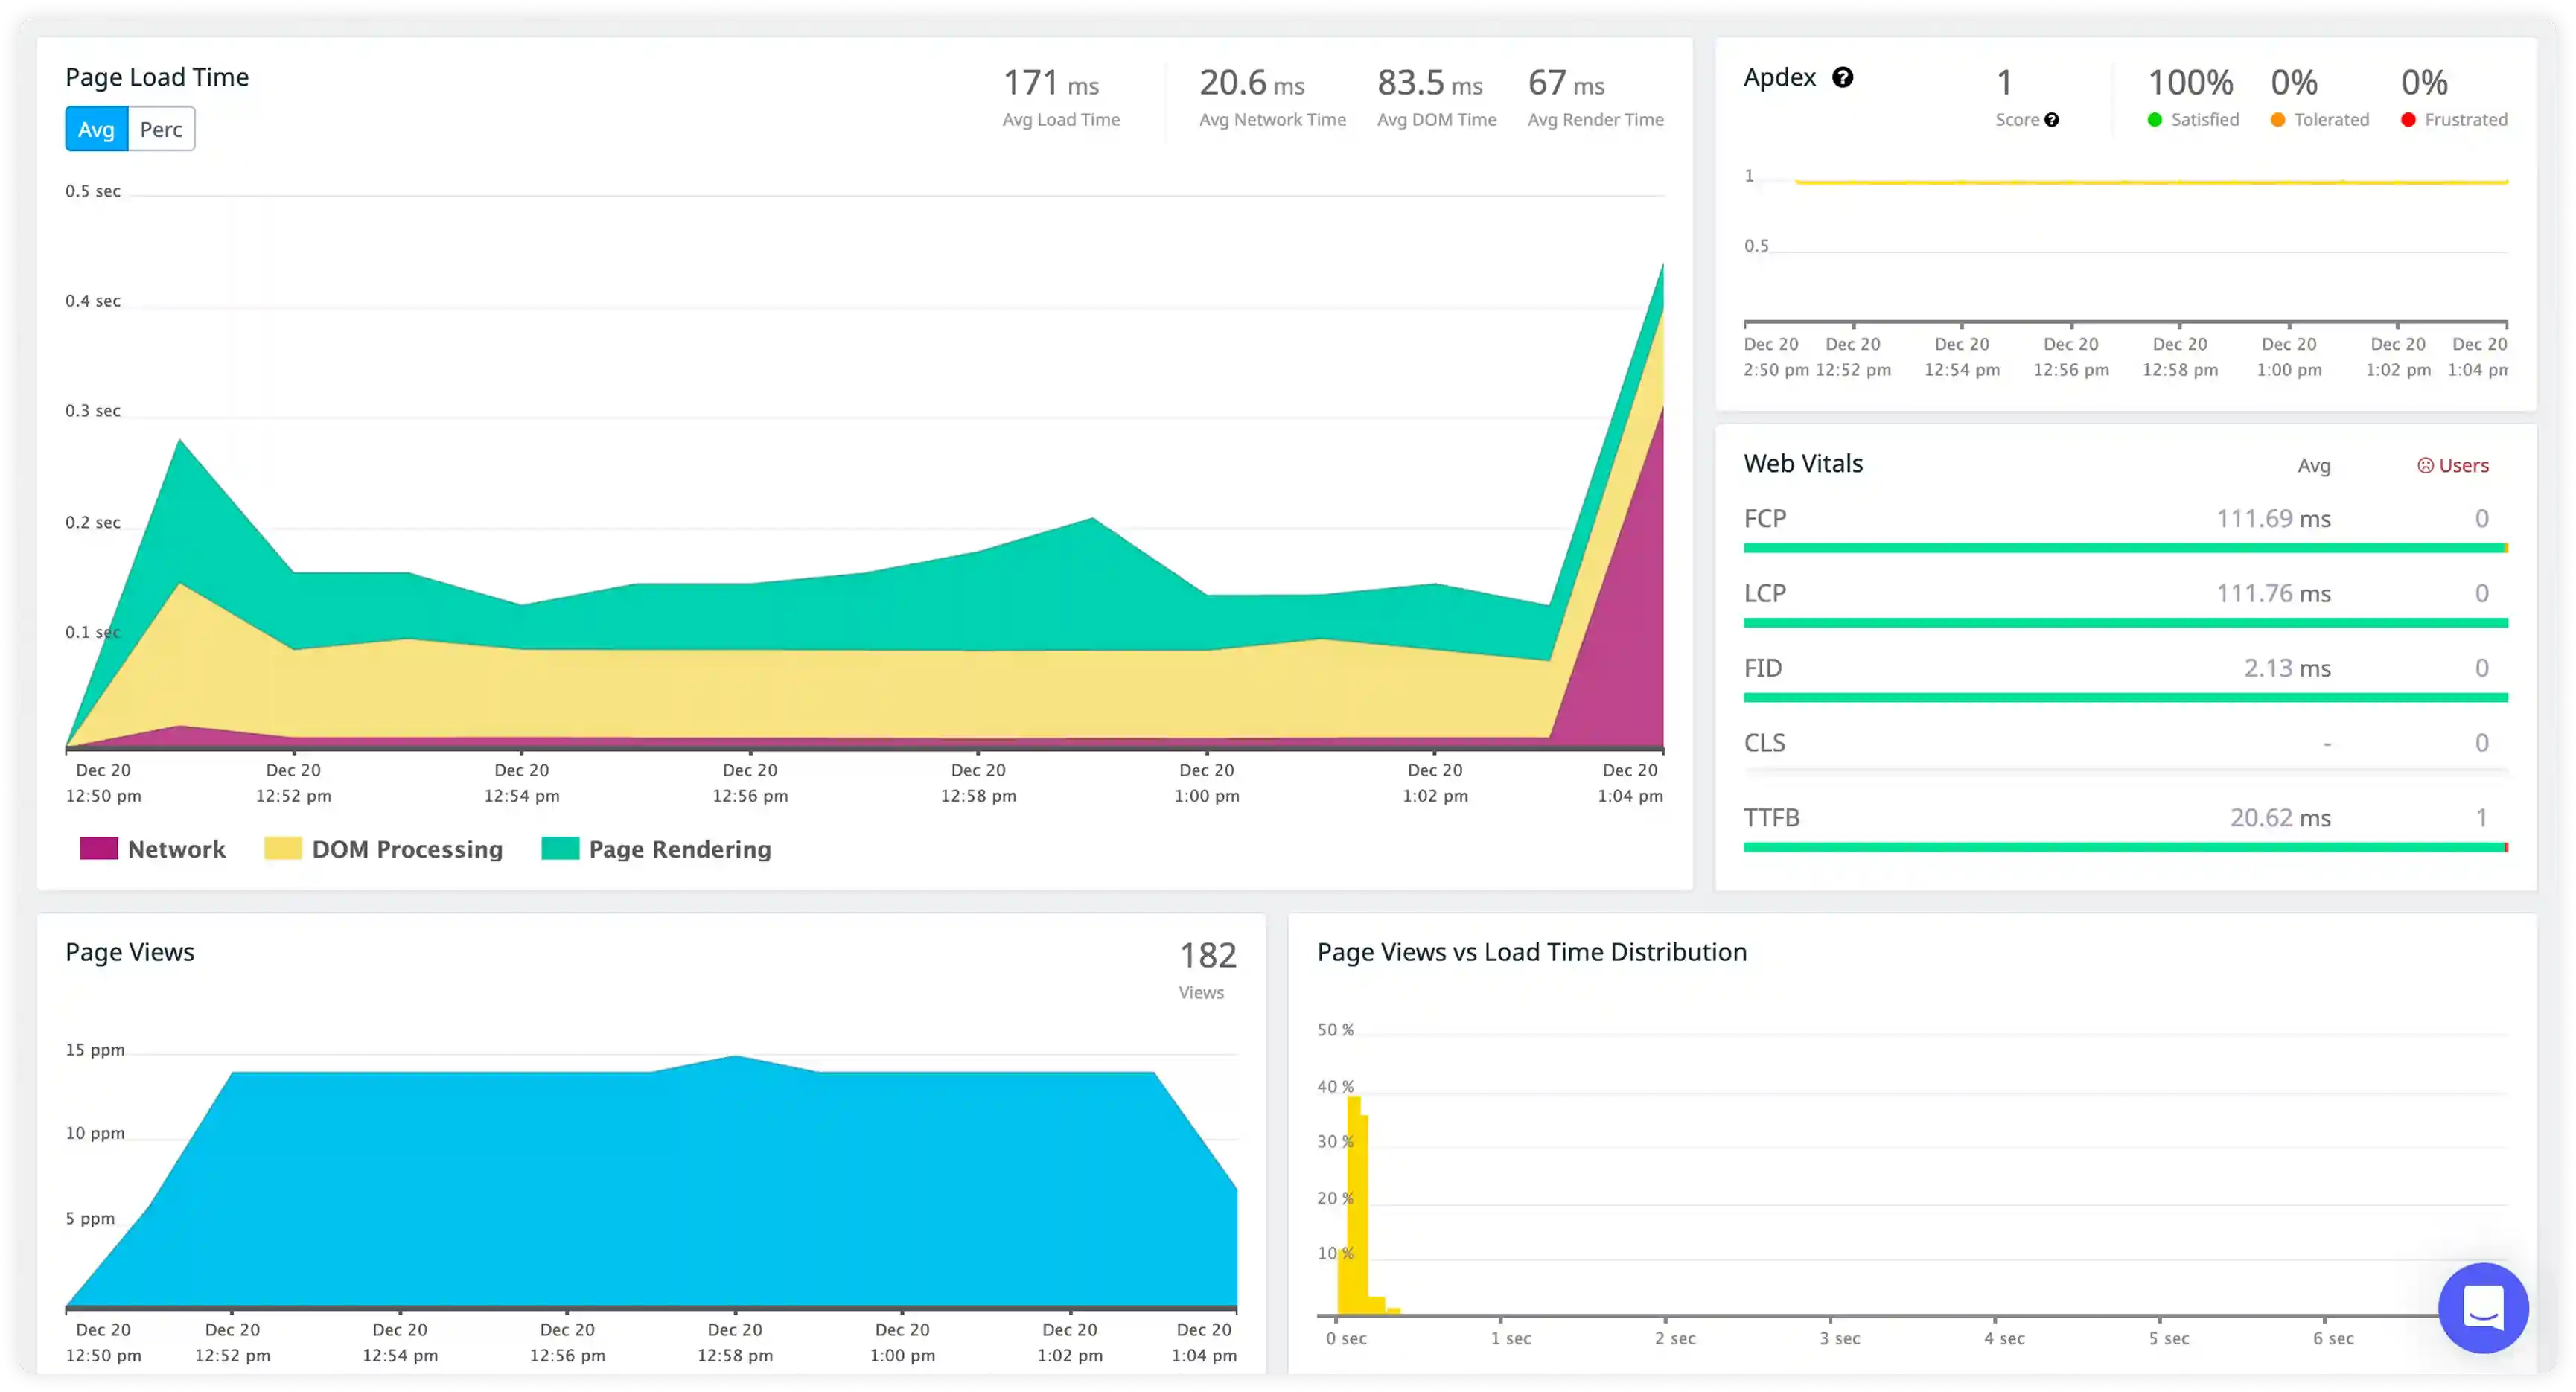
- Measure view render frequency during real user interactions and correlate execution cost with actual DOM update latency to understand rendering performance.
- Identify repeated render triggers from model or collection changes that do not result in meaningful UI updates, creating unnecessary processing overhead.
- Analyze template rendering timing in detail to isolate the exact contributors to visual delays and slow screen updates.
- Detect propagation of view updates across dependent components that causes redundant DOM operations and layout instability.

Model and Collection Update Execution
- Measure latency between model state changes and the resulting view re-render execution across application workflows to understand data-to-UI propagation speed.
- Identify frequent collection updates that trigger repeated UI refresh cycles, unnecessary reflows, and increased CPU usage under active workloads.
- Analyze event bindings between models, collections, and views in detail to surface inefficient update chains, cascading triggers, and avoidable render paths.
- Detect redundant data synchronization patterns between client and server that cause UI instability, excessive rendering overhead, and wasted network calls.

Event Handling and Asynchronous Execution
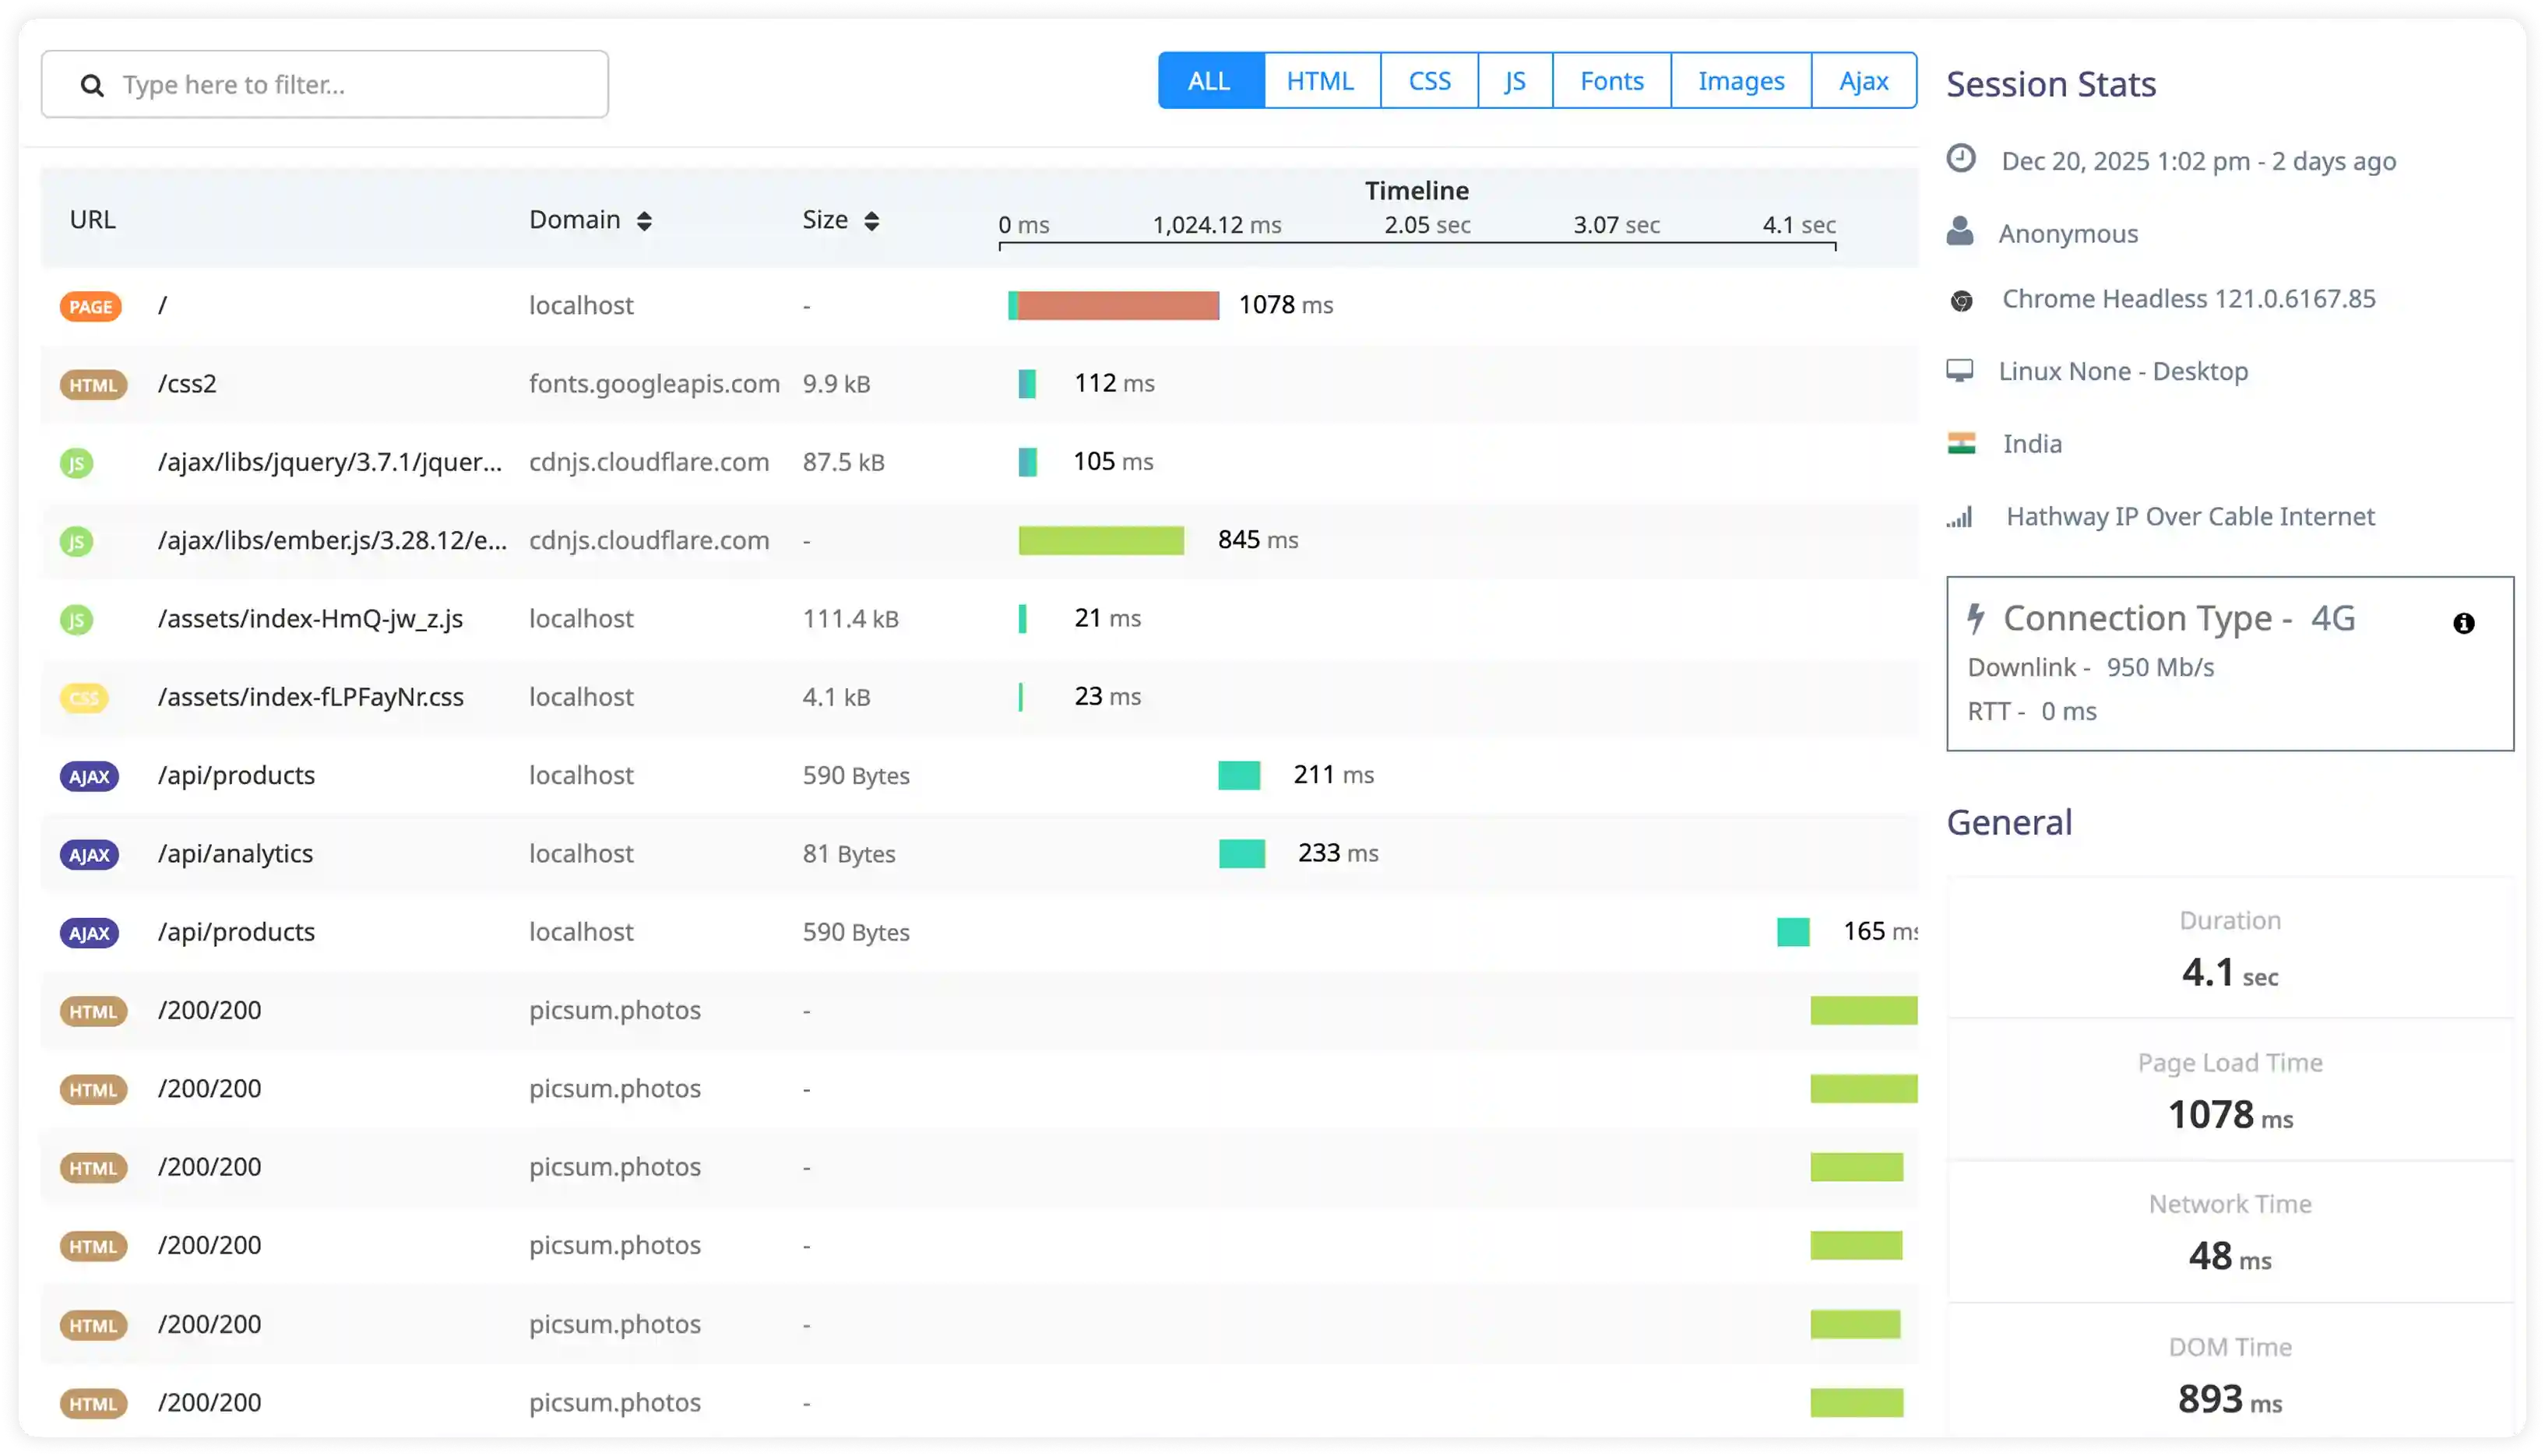
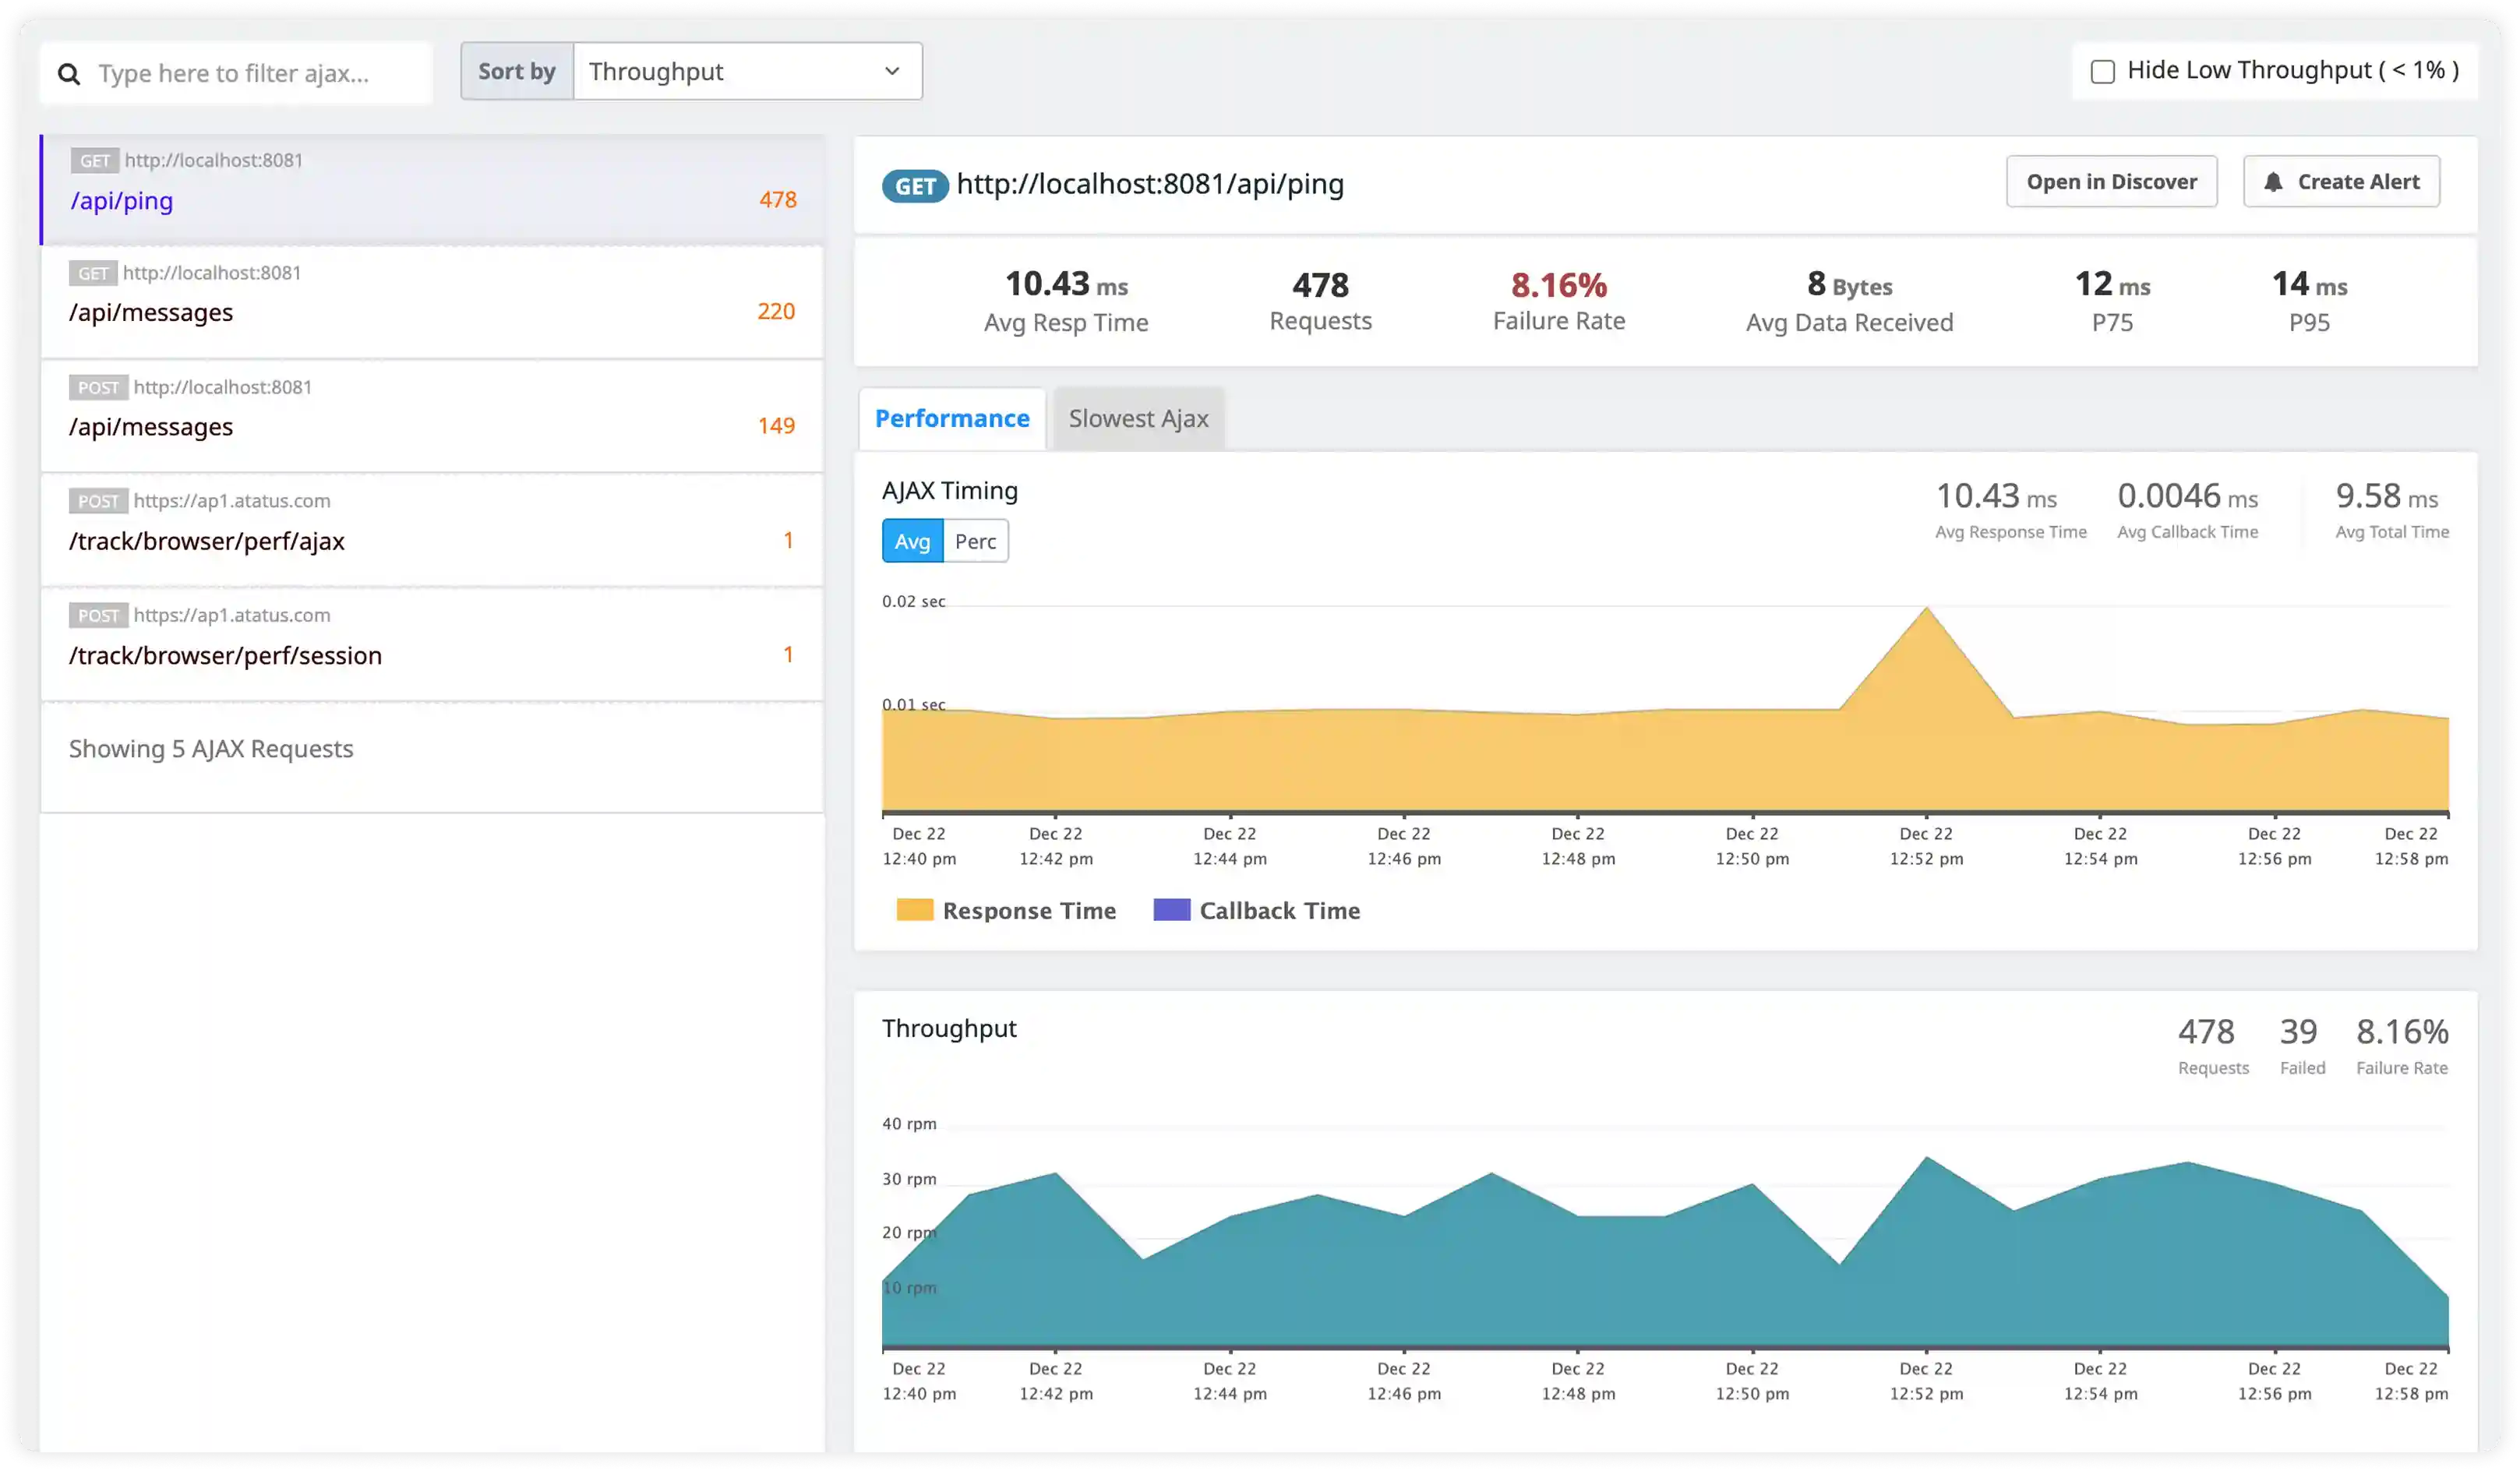
- Track execution of user-triggered events, AJAX requests, background synchronization tasks, and asynchronous workflows across the application lifecycle.
- Measure the delay between async operation completion and subsequent view rendering updates to identify slow UI response paths.
- Identify concurrent async operations that compete for main thread resources, block rendering, and degrade interaction responsiveness.
- Correlate async execution timing with workflow interruptions, perceived latency, and visual stability issues.

Routing and Navigation Execution
- Break down route handling timing across controller logic, data fetching, middleware processing, and final view rendering stages.
- Identify blocking operations during navigation such as heavy data loads or synchronous logic that delay screen updates and interaction readiness.
- Measure latency in route-triggered data loading across different devices, browsers, and network environments to surface performance gaps.
- Correlate navigation execution timing with UI responsiveness, smooth transitions, and continuity of user workflows.

Why Choose Atatus for Backbone RUM?
Optimize Backbone MVC performance, event delegation, and legacy SPA routing without code modernization
Built for Backbone MVC
Native understanding of Models, Collections, Views, and Routers with event-driven lifecycle tracing.
Legacy Backbone diagnostics
View render traces, model sync waterfalls, and event delegation analysis for enterprise Backbone.js applications.
Non-intrusive legacy monitoring
Lightweight agent works with existing Backbone apps—no require.js/AMD modifications or migration required.
Backbone-specific Core Web Vitals
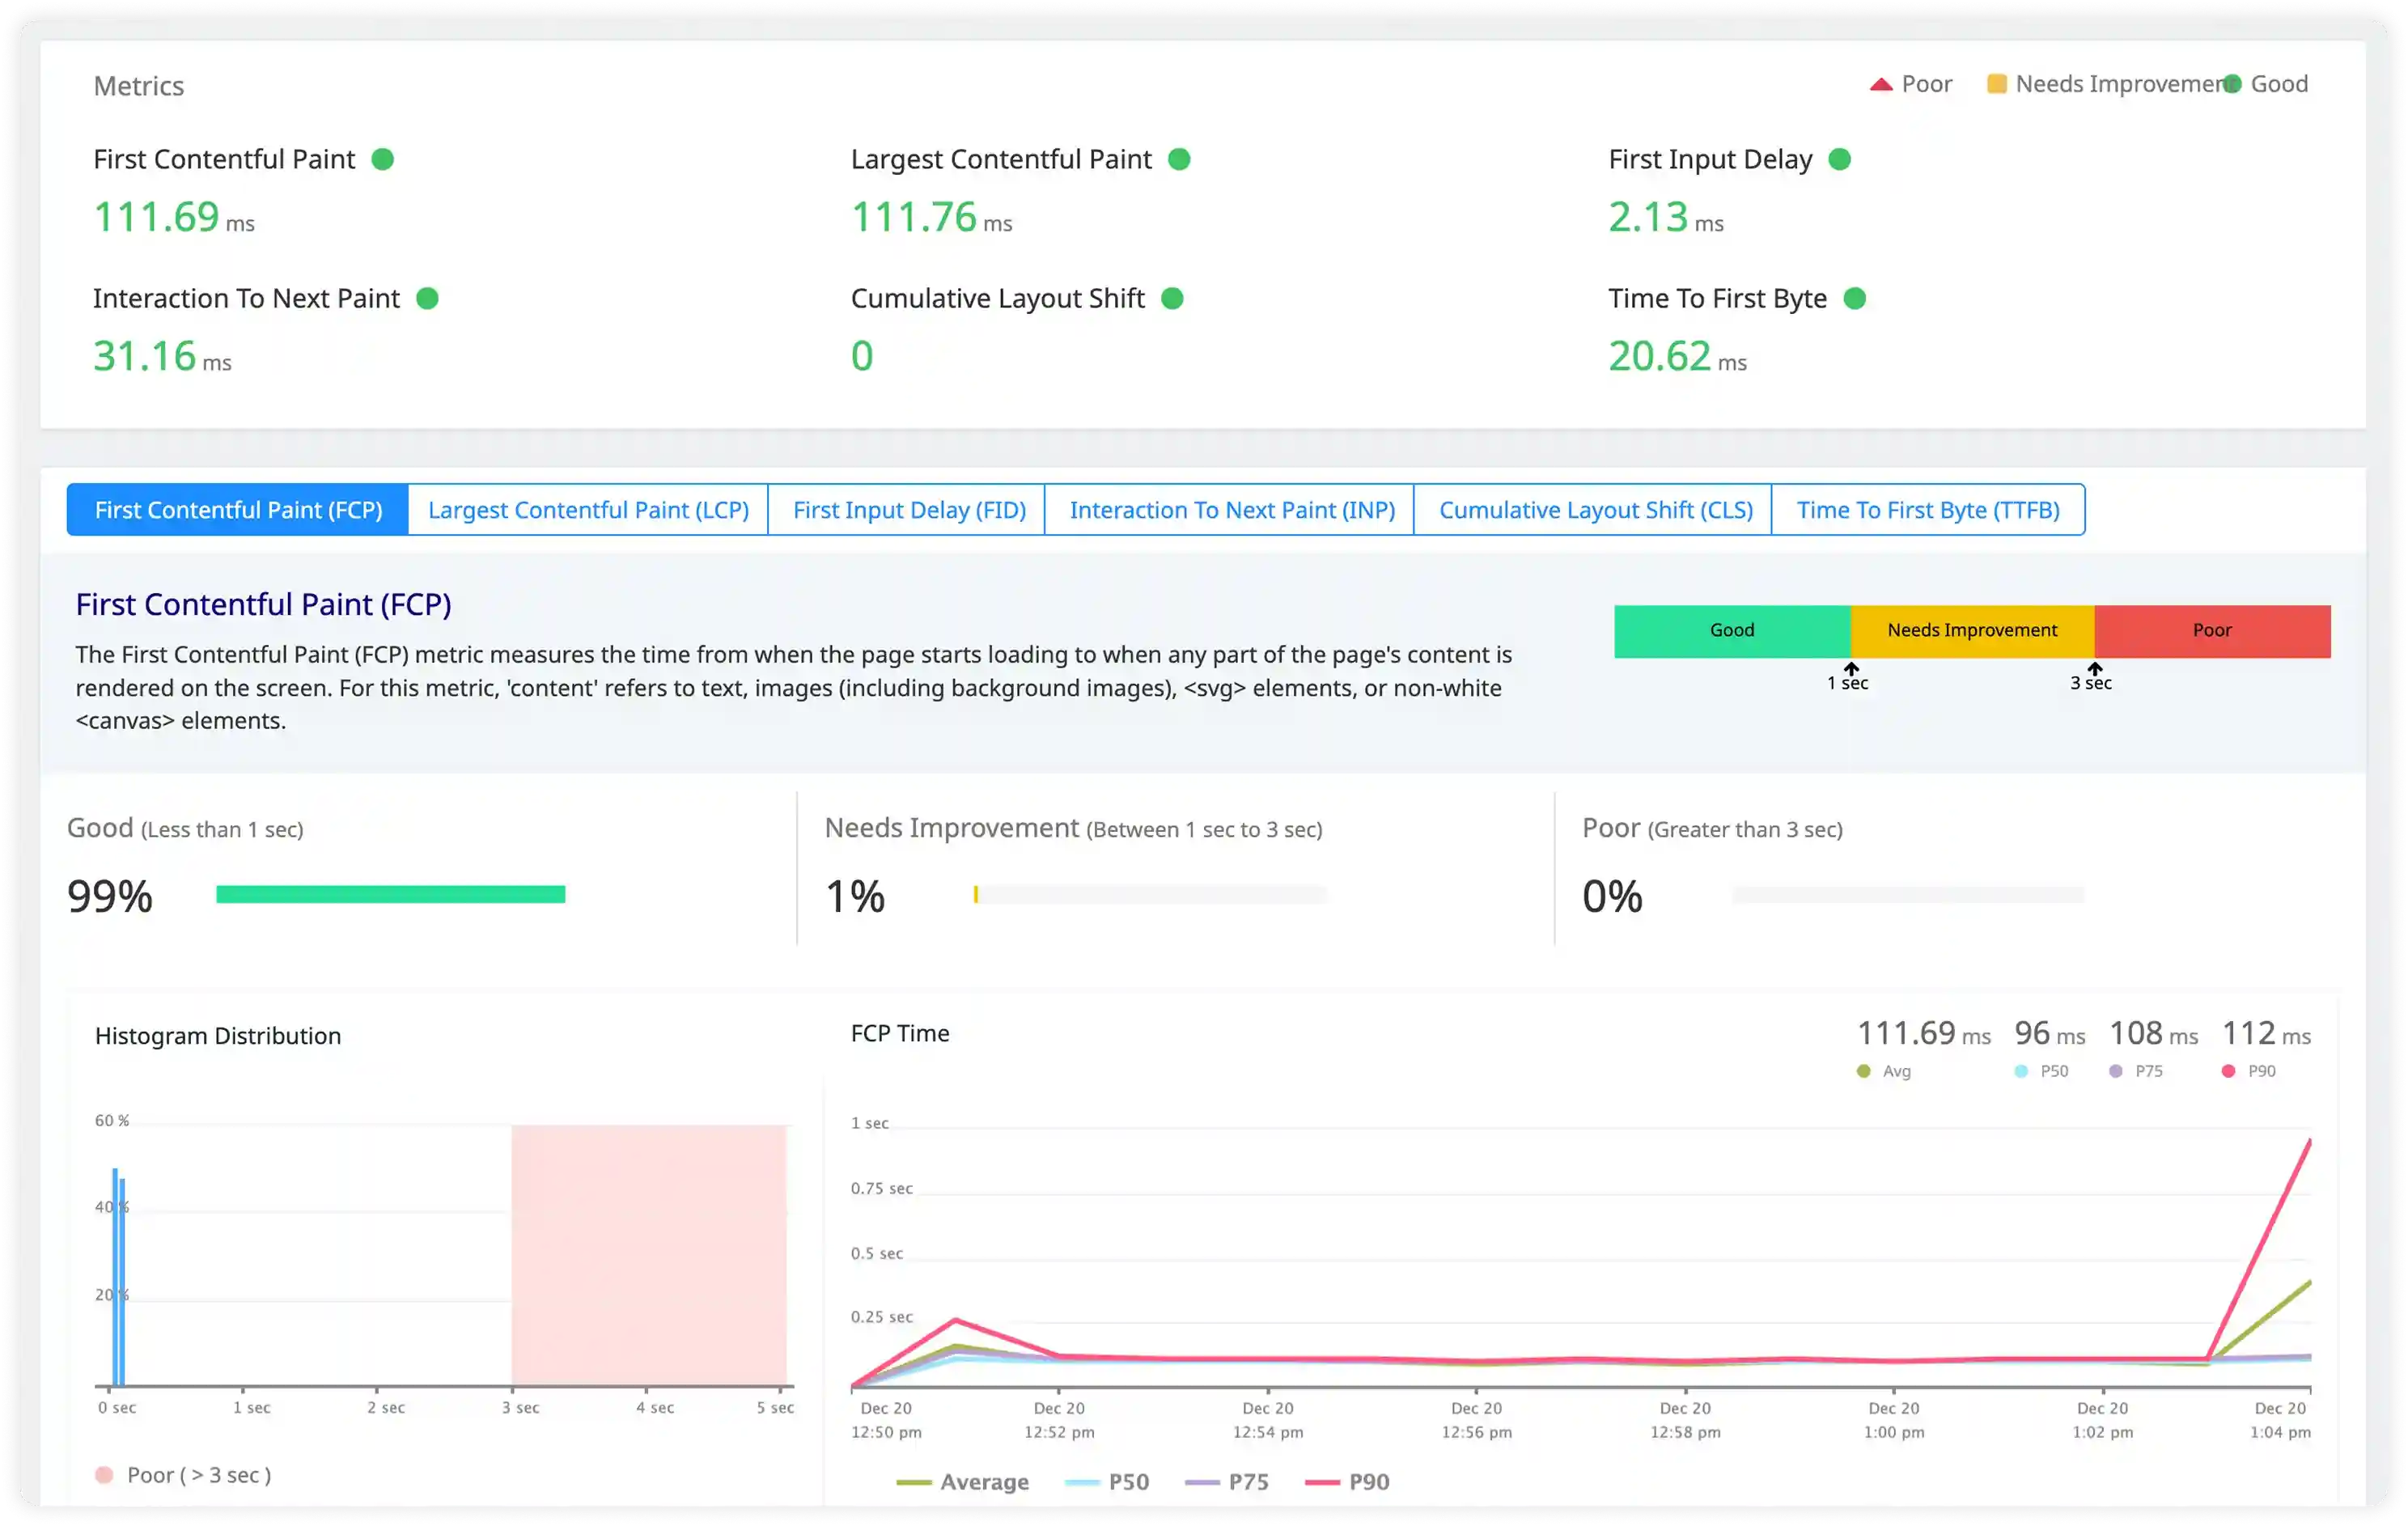
LCP, CLS, FID metrics attributed to view renders, model fetches, and router transitions.
Enterprise legacy SPA scaling
Reliable monitoring for high-traffic Backbone applications still powering critical business workflows.
Predictable legacy pricing
Scalable pricing for Backbone.js monitoring that grows with user sessions—no migration costs.
Unified Observability for Every Engineering Team
Atatus adapts to how engineering teams work across development, operations, and reliability.
Developers
Trace requests, debug errors, and identify performance issues at the code level with clear context.
DevOps
Track deployments, monitor infrastructure impact, and understand how releases affect application stability.
Release Engineer
Measure service health, latency, and error rates to maintain reliability and reduce production risk.