Observability Platform for Release Teams
Enhance release quality, frequency, and operational efficiency through real-time monitoring of performance errors and correlated data across environments. Monitor the entire release management process from start to finish.
3.4s
Avg time-to-fix with Atatus DEM
99.9%
Platform uptime SLA
40%
Reduction in customer-reported bugs
1000+
Engineering teams trust Atatus
Know Exactly What's Happening Across Every User Experience
From slow interactions to critical failures, gain complete visibility into your application and respond with confidence.
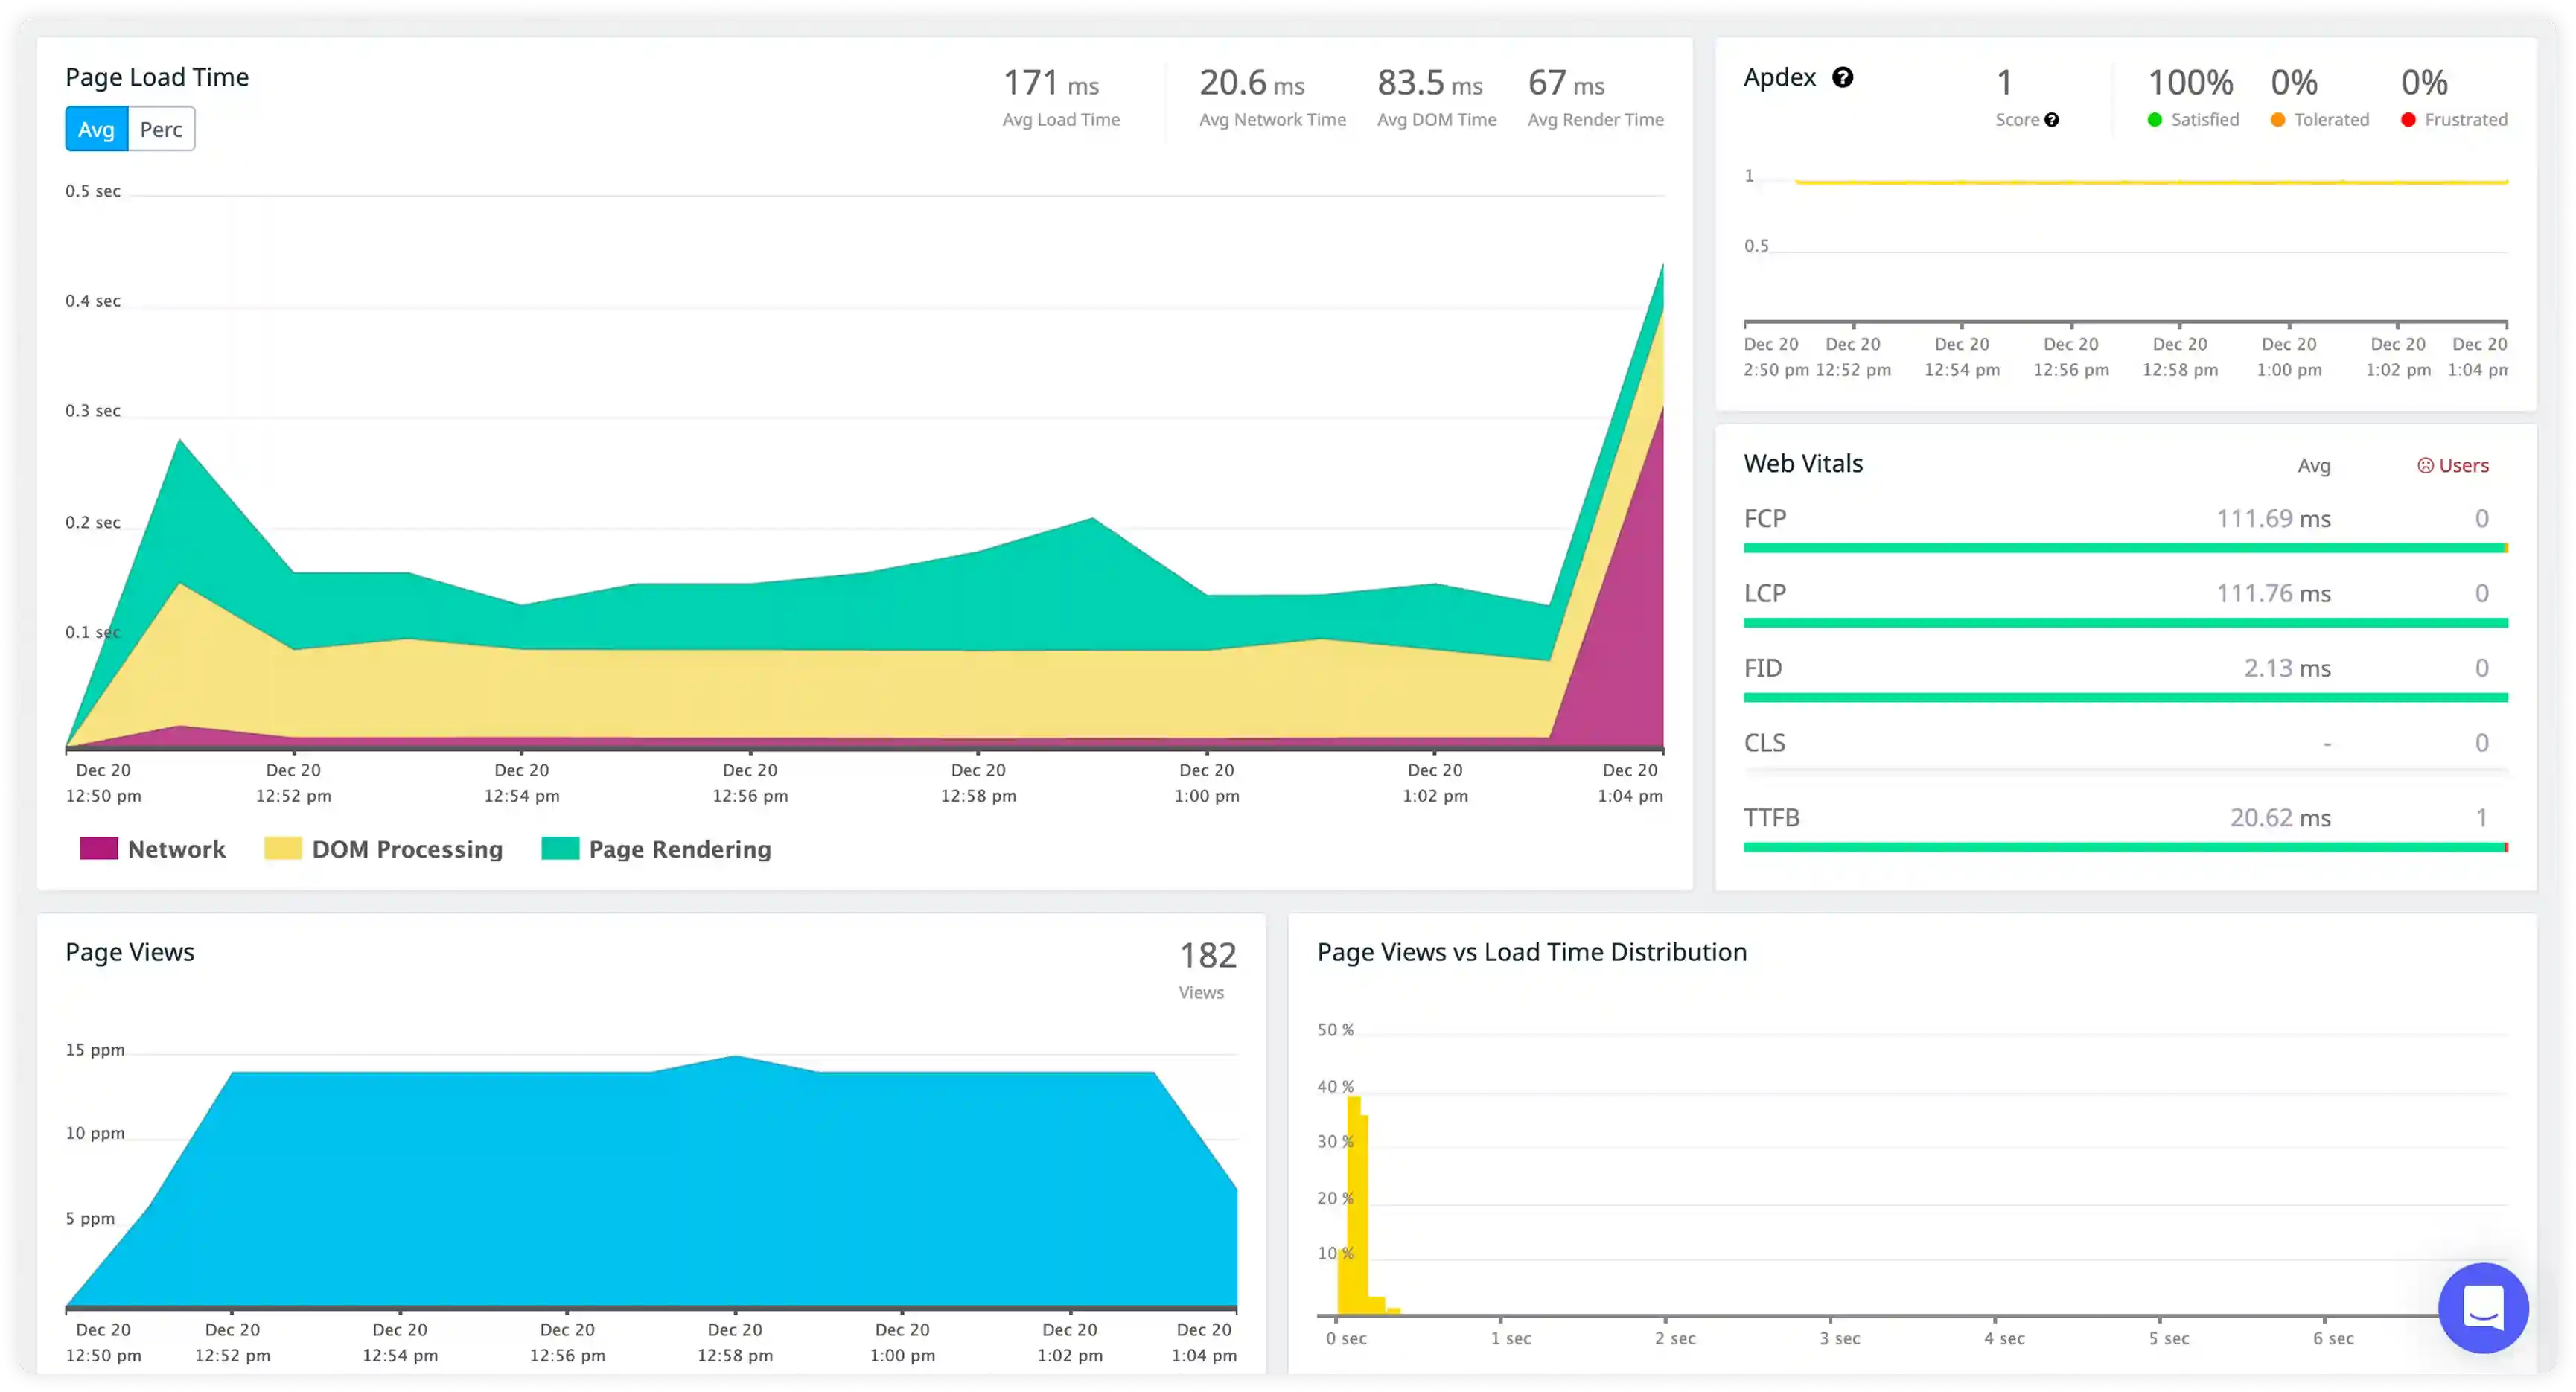
Understand Frontend Performance Across Every User Journey
Capture Core Web Vitals, custom performance marks, and JavaScript errors across 100% of your real traffic, not a sampled subset. Segment by geography, browser, OS, and user cohort instantly.
- LCP, FID, CLS, TTFB out of the box. No configuration required
- User journey funnels reveal exactly where drop-offs happen
- Resource waterfall view connects slow APIs to page slowdowns
- Single-page app support for React, Vue, Angular, Next.js
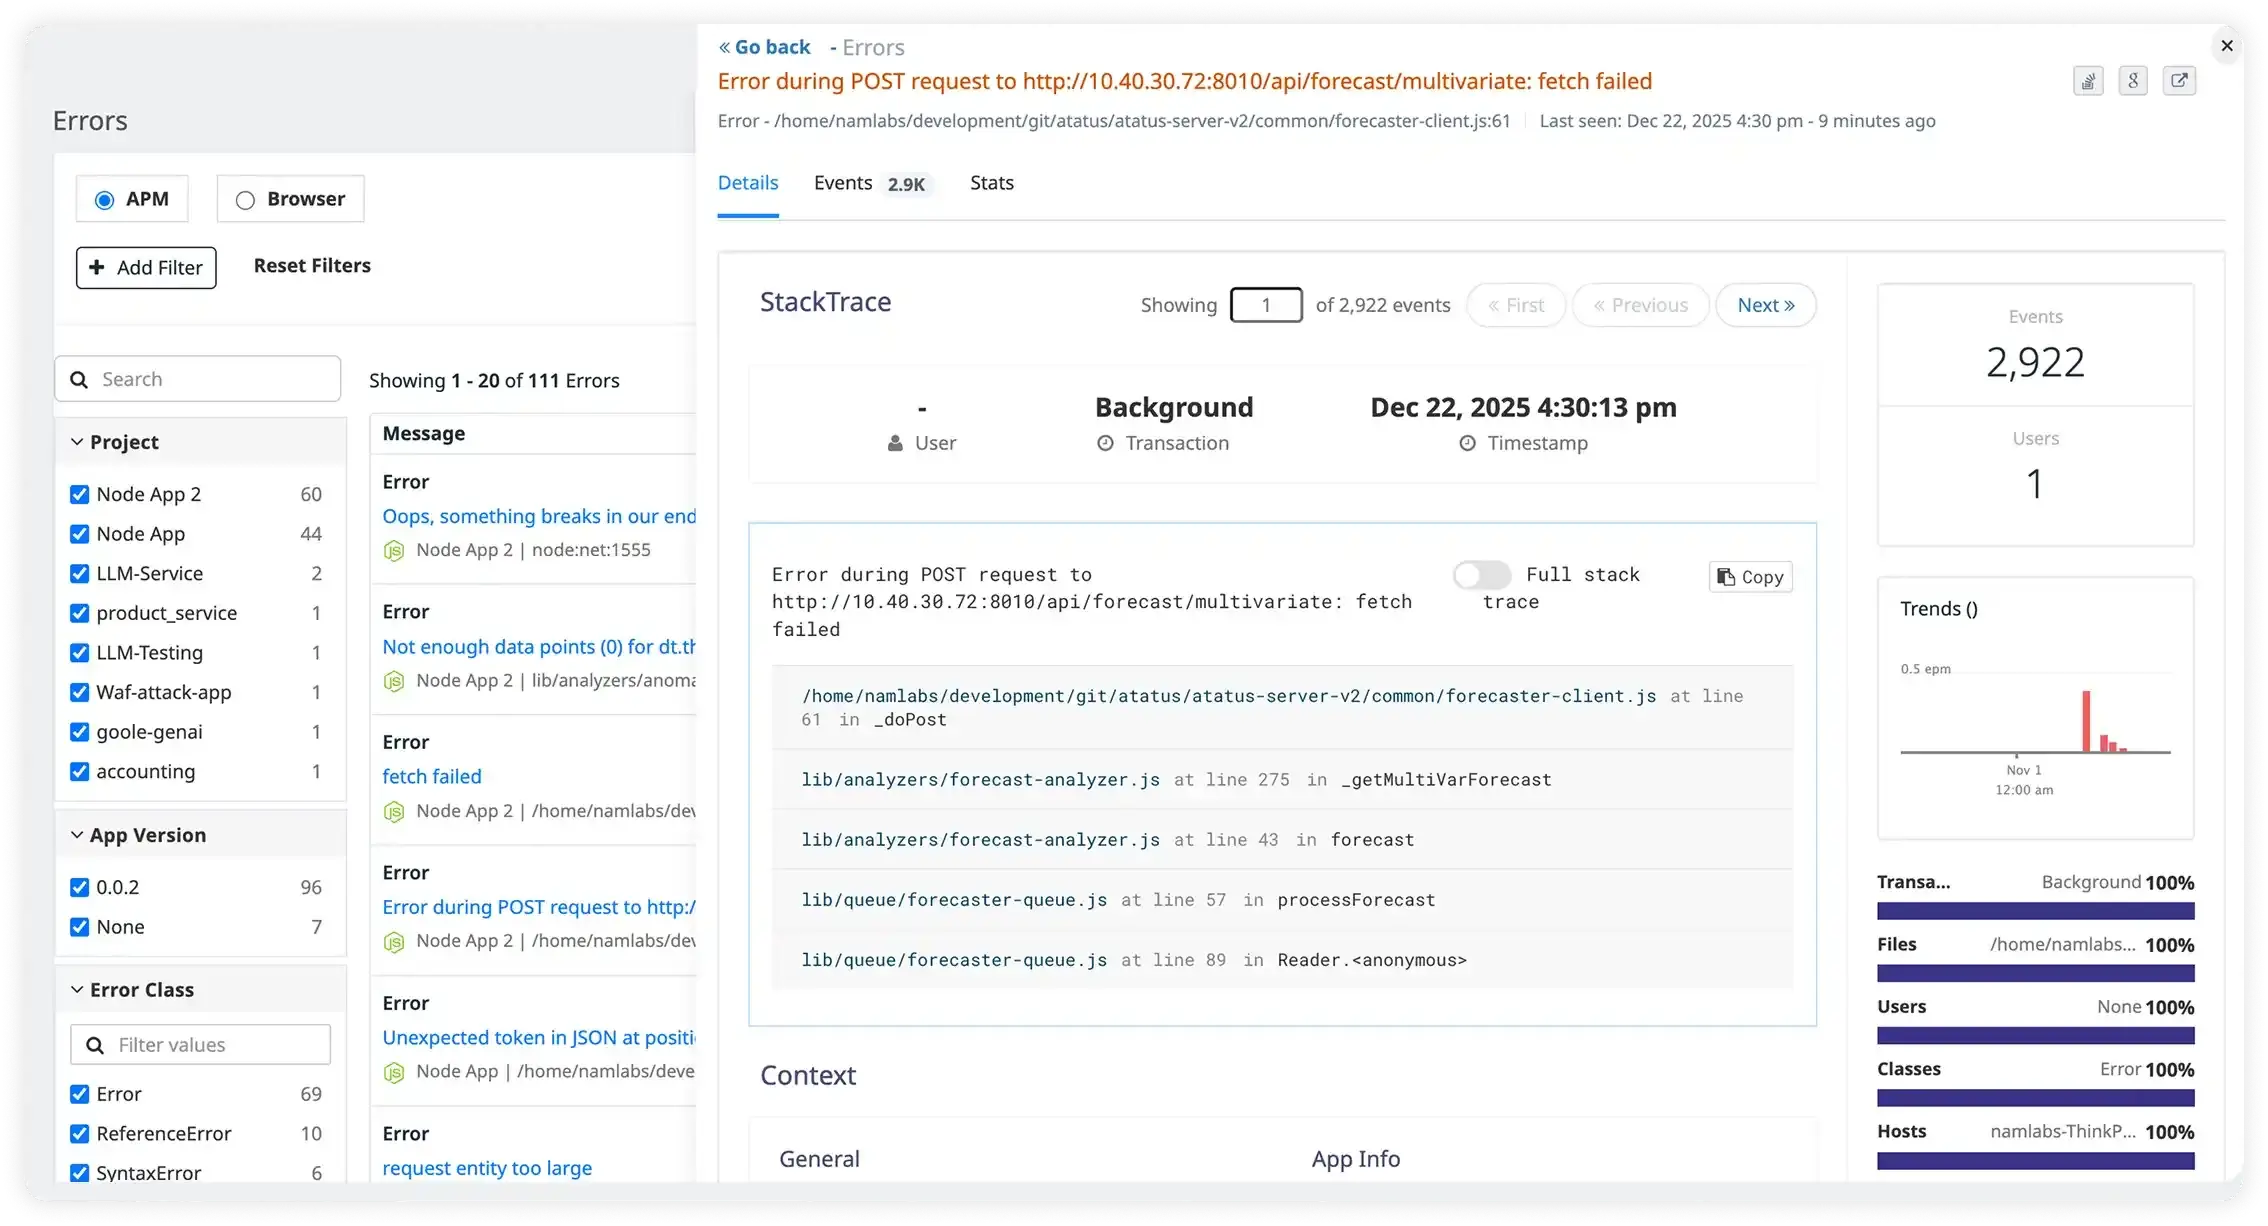
Turn Error Noise into Actionable Insights
Atatus intelligently deduplicates and groups JavaScript errors so you see "500 occurrences of this null-pointer" instead of 500 separate alerts. Assign to owners, track regressions across deploys.
- Source map upload - see original source lines, not minified noise
- Deploy markers - instantly know if a new release caused a spike
- Slack, PagerDuty, Jira, and webhook integrations included
- Trend-based alerting - alert on error rate change, not just raw count
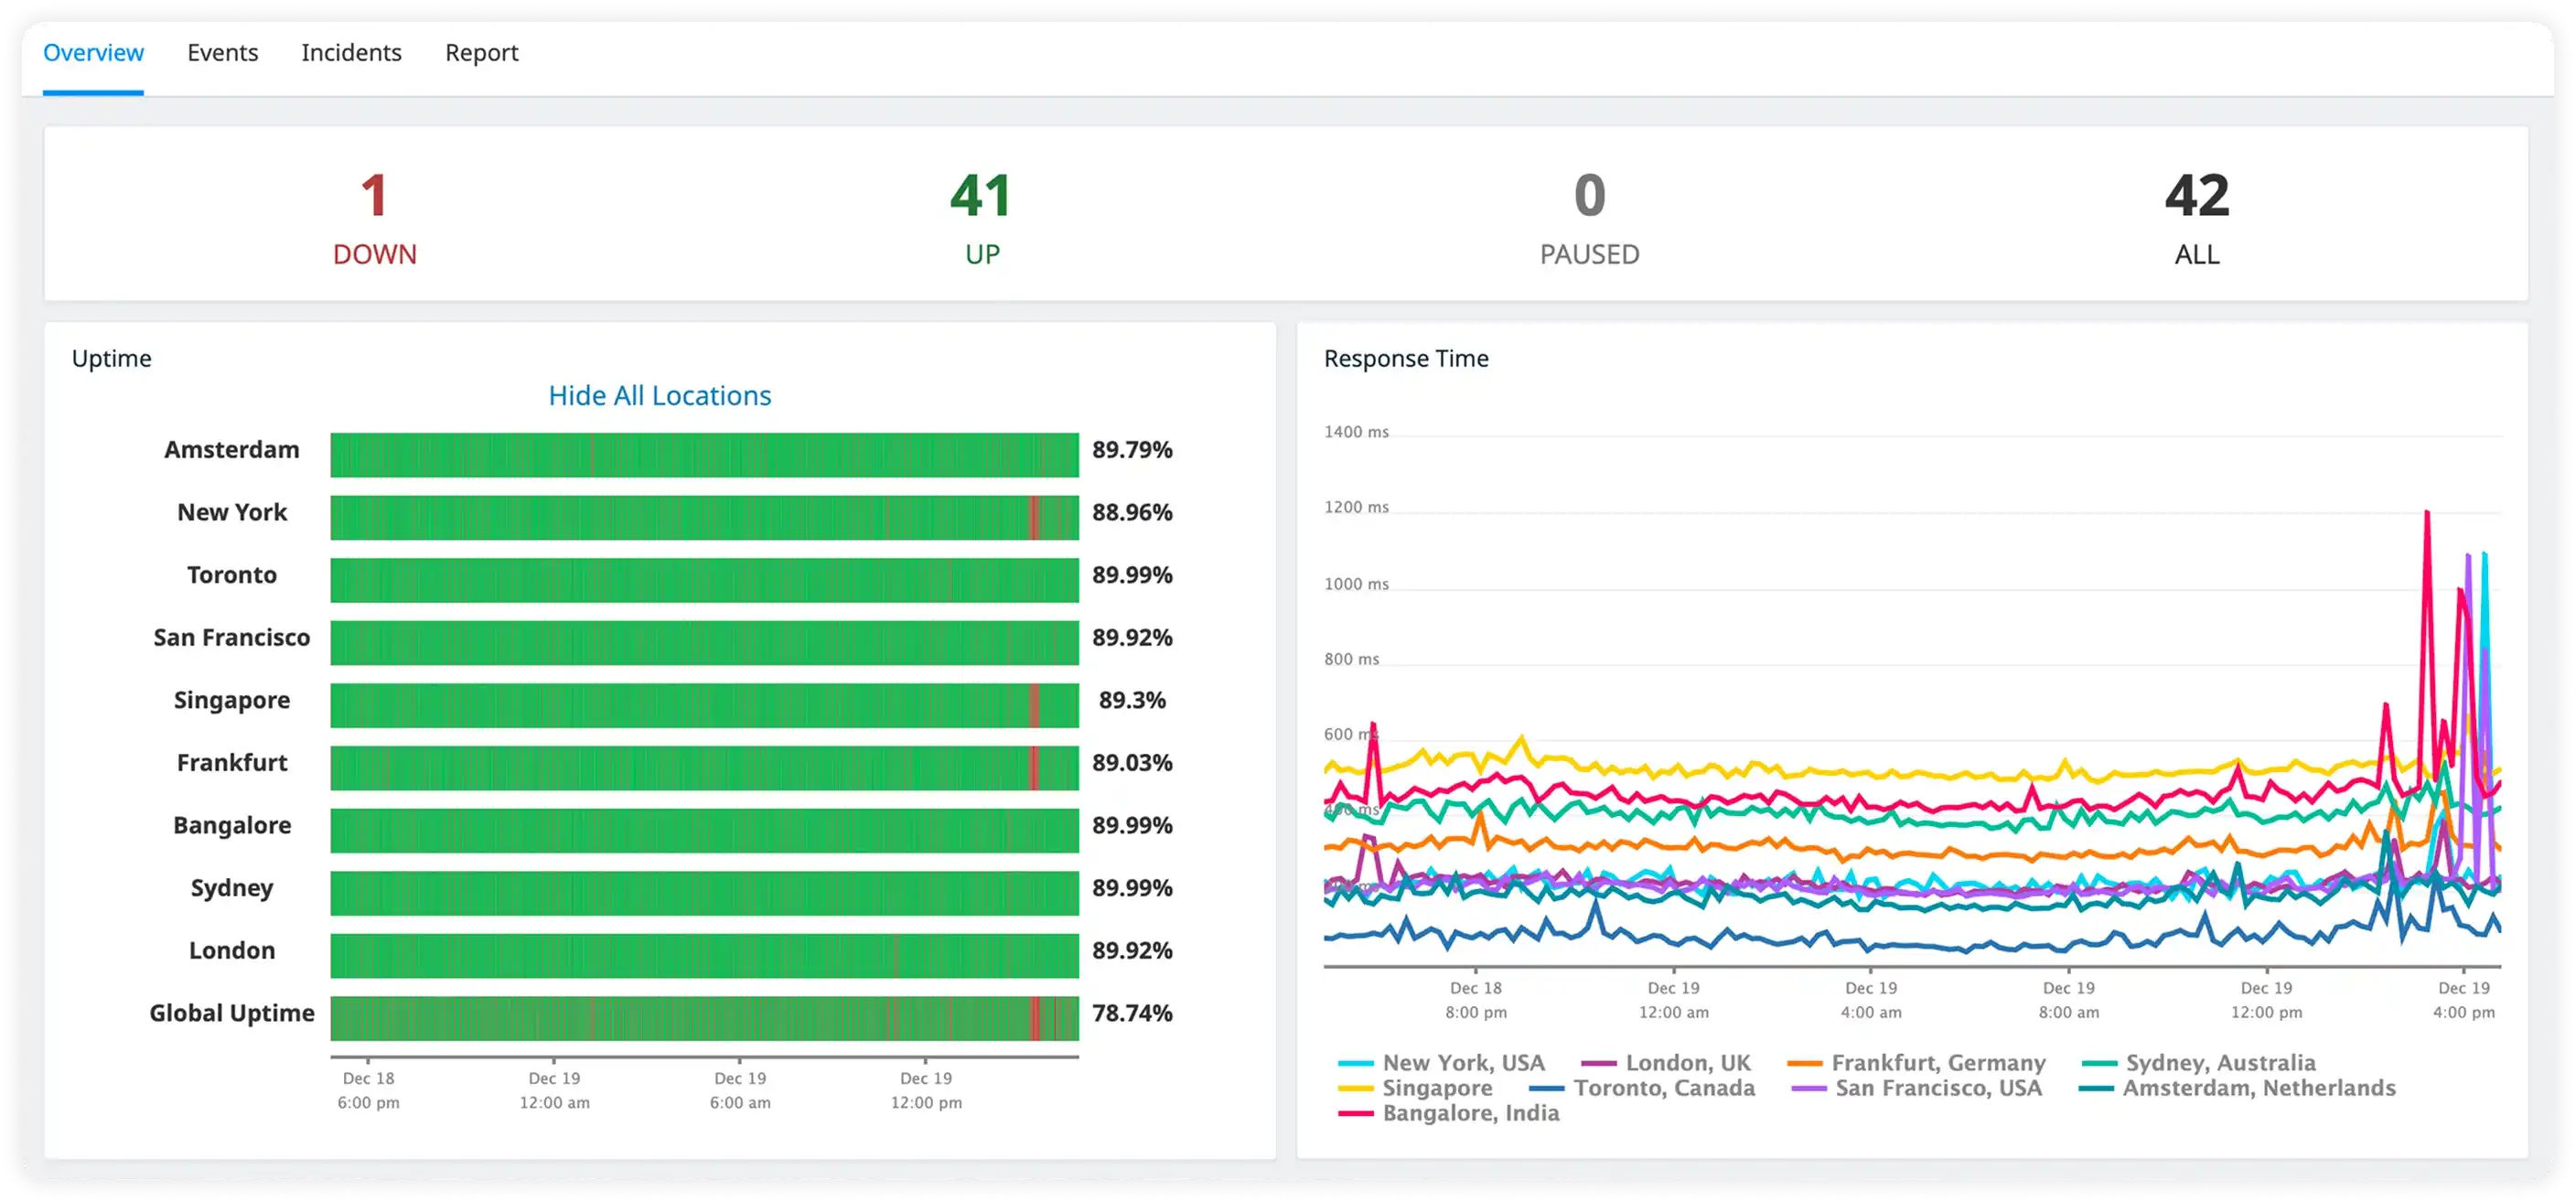
Proactively Monitor Uptime Across APIs and User Journeys
Run scripted browser tests from 50+ global locations 24/7. Catch login flows, checkout sequences, and API availability issues before they hit real users. Set SLAs per endpoint and get alerted instantly on breach.
- No-code test recorder, engineers and QA both contribute
- API, Browser, and multi-step transaction monitors in one place
- SLA dashboards for uptime reporting to stakeholders
- Private locations for internal apps behind VPN
From User Experience to Root Cause
Frontend → Backend Correlation
Click any slow XHR in a RUM session and jump directly to its backend APM trace. Shared trace IDs, no manual log digging.
User Journey & Funnel Analytics
Map where users drop off, which paths convert, and how performance at each step affects completion rates, not just page-level metrics.
Alerting & SLO Tracking
Define SLOs on any metric. Anomaly-based, threshold, and trend alerts routed to Slack, PagerDuty, or webhook, no alert fatigue.
Custom Dashboards
Build engineering and executive views side by side. Share live SLA dashboards with stakeholders, no login required.
Deploy Markers
Annotate every release on your performance timeline. Instantly correlate error spikes and latency regressions with the exact deploy that caused them.
Privacy-First by Default
PII masking on by default. SOC 2 Type II certified, GDPR compliant, with configurable data residency built for regulated industries.
Unified Observability for Every Engineering Team
Atatus adapts to how engineering teams work across development, operations, and reliability.
Developers
Trace requests, debug errors, and identify performance issues at the code level with clear context.
DevOps
Track deployments, monitor infrastructure impact, and understand how releases affect application stability.
Release Engineer
Measure service health, latency, and error rates to maintain reliability and reduce production risk.
Milestones that spark performance excellence
Reflections from clients who've achieved unmatched excellence through innovative strategies.
Read customer stories


