Stop Hunting Through Millions of Logs. Start Seeing Answers
Atatus unifies logs, traces, and metrics into a single correlated timeline, so your team diagnoses incidents in minutes, not hours, regardless of how many services are involved.
13x
Faster threat detection after enabling SIEM correlation
Enterprise security team
<1%
Agent CPU overhead in production
Measured across Linux & Kubernetes
5 min
Average setup time for log ingestion
No infrastructure changes required
40%
Reduced investigation time
Reported by SOC teams
Know Exactly What's Happening Across Your Systems
Bring logs, traces, and metrics together in a single view to understand system behavior, investigate issues faster, and gain the context needed to resolve incidents with confidence.
Automatic Log Parsing Across Any Format
Atatus automatically parses logs in JSON, syslog, Apache, NGINX, and 300+ other formats out of the box. No pipelines to manage, no parsing rules to maintain. Send logs and start querying immediately.
- Auto-parse JSON, logfmt, CEF, W3C, and custom formats without configuration
- Enrich logs with service metadata, geo-IP, user identity, and deployment context at ingest time
- Normalize attributes across log sources so fields like `status_code`, `duration`, and `user_id` work identically everywhere
- Smart sampling and filtering to reduce noise and storage cost without losing signal
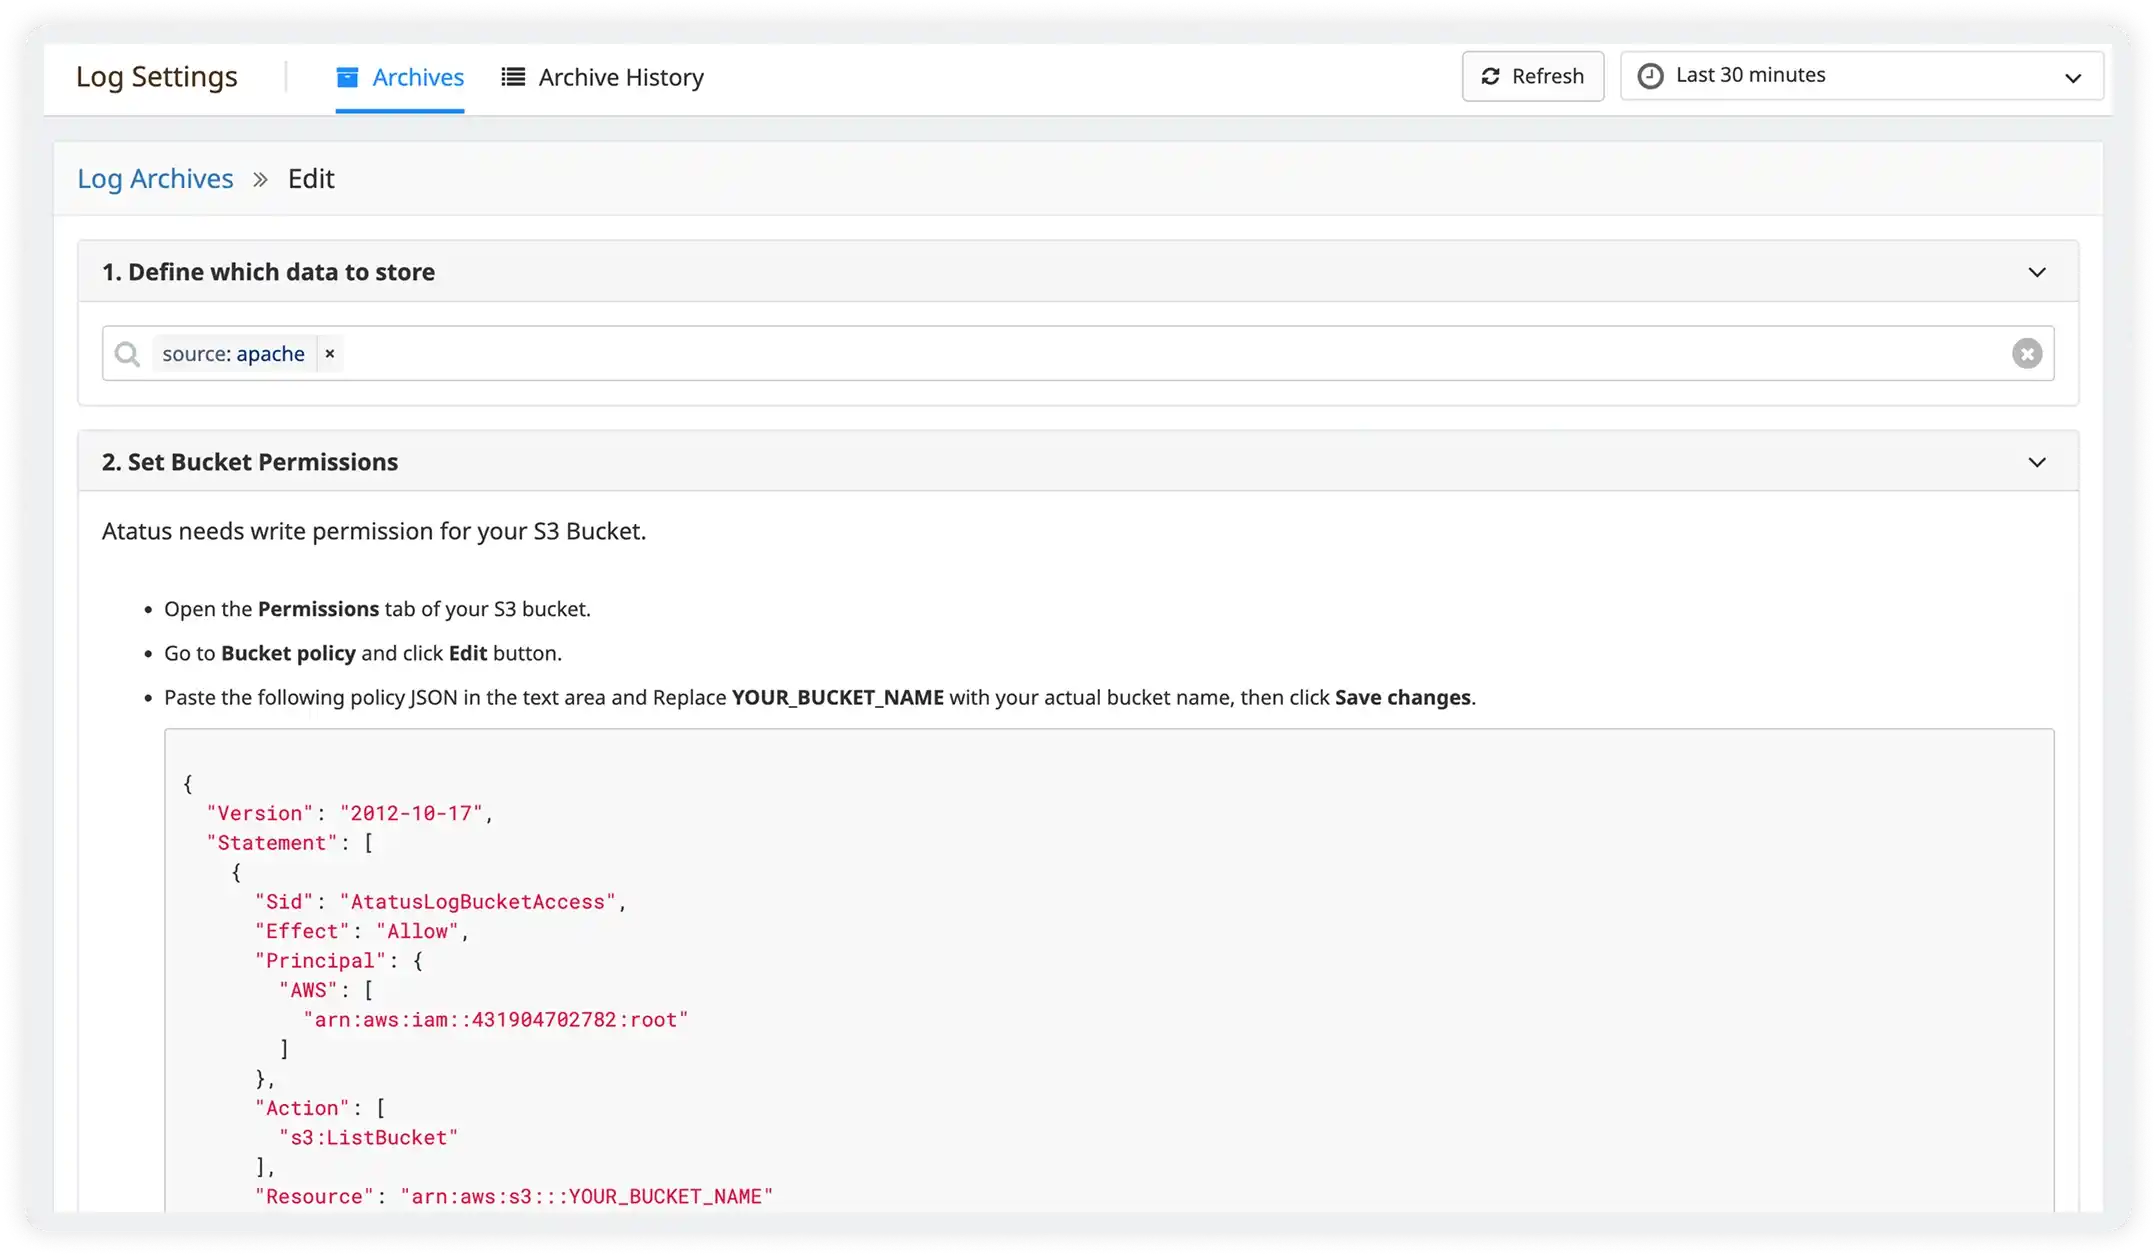
- Ingestion pipeline with transforms, masking for PII/sensitive data, and routing rules
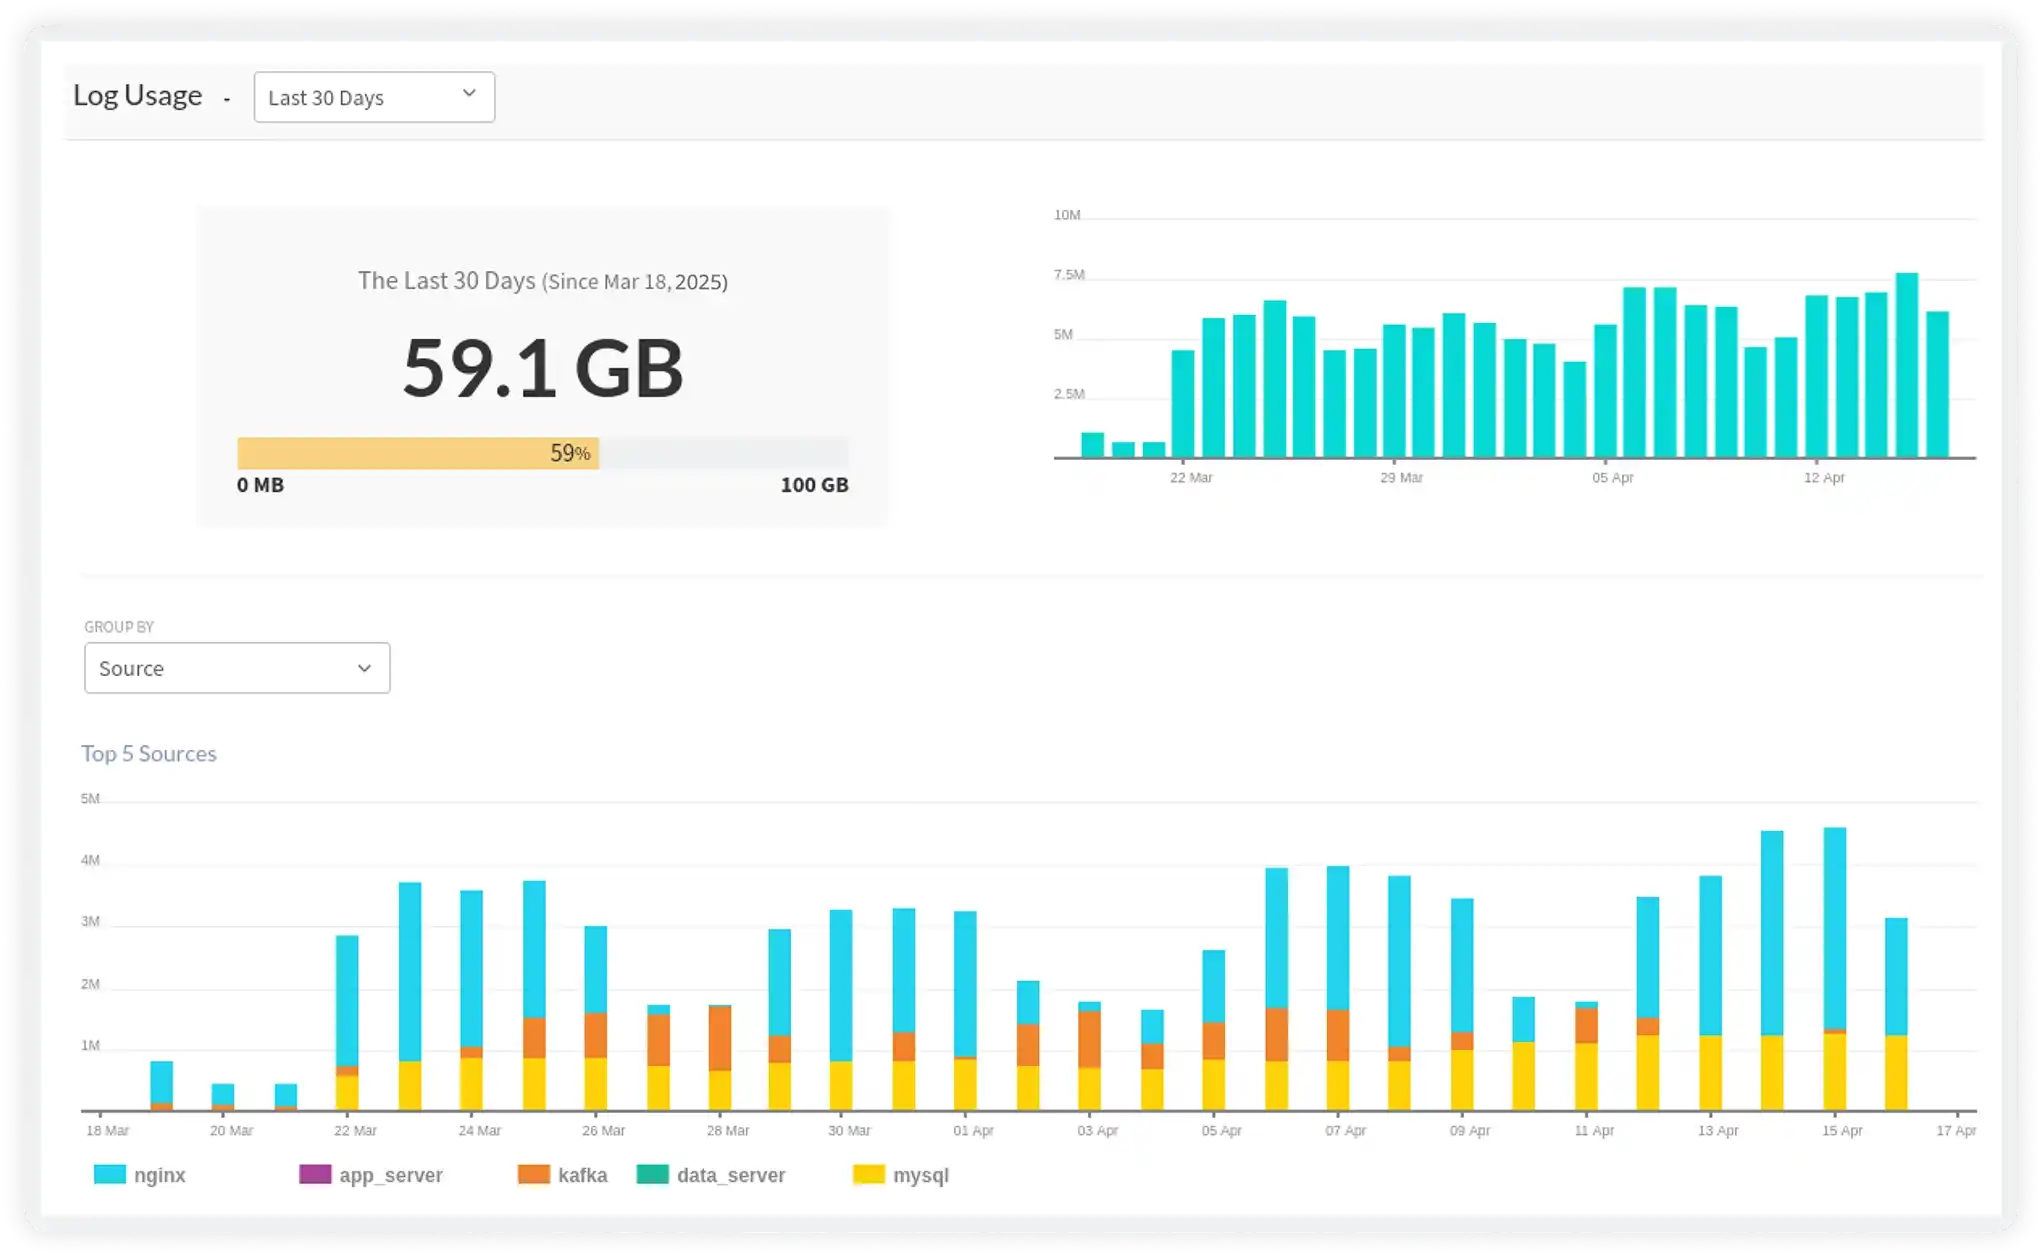
Search and Analyze Logs Without Complexity
Atatus Log Explorer gives every engineer, not just the ones who know the query syntax. The ability to slice, filter, and investigate at any scale. No indexes to pre-build, no cluster to tune.
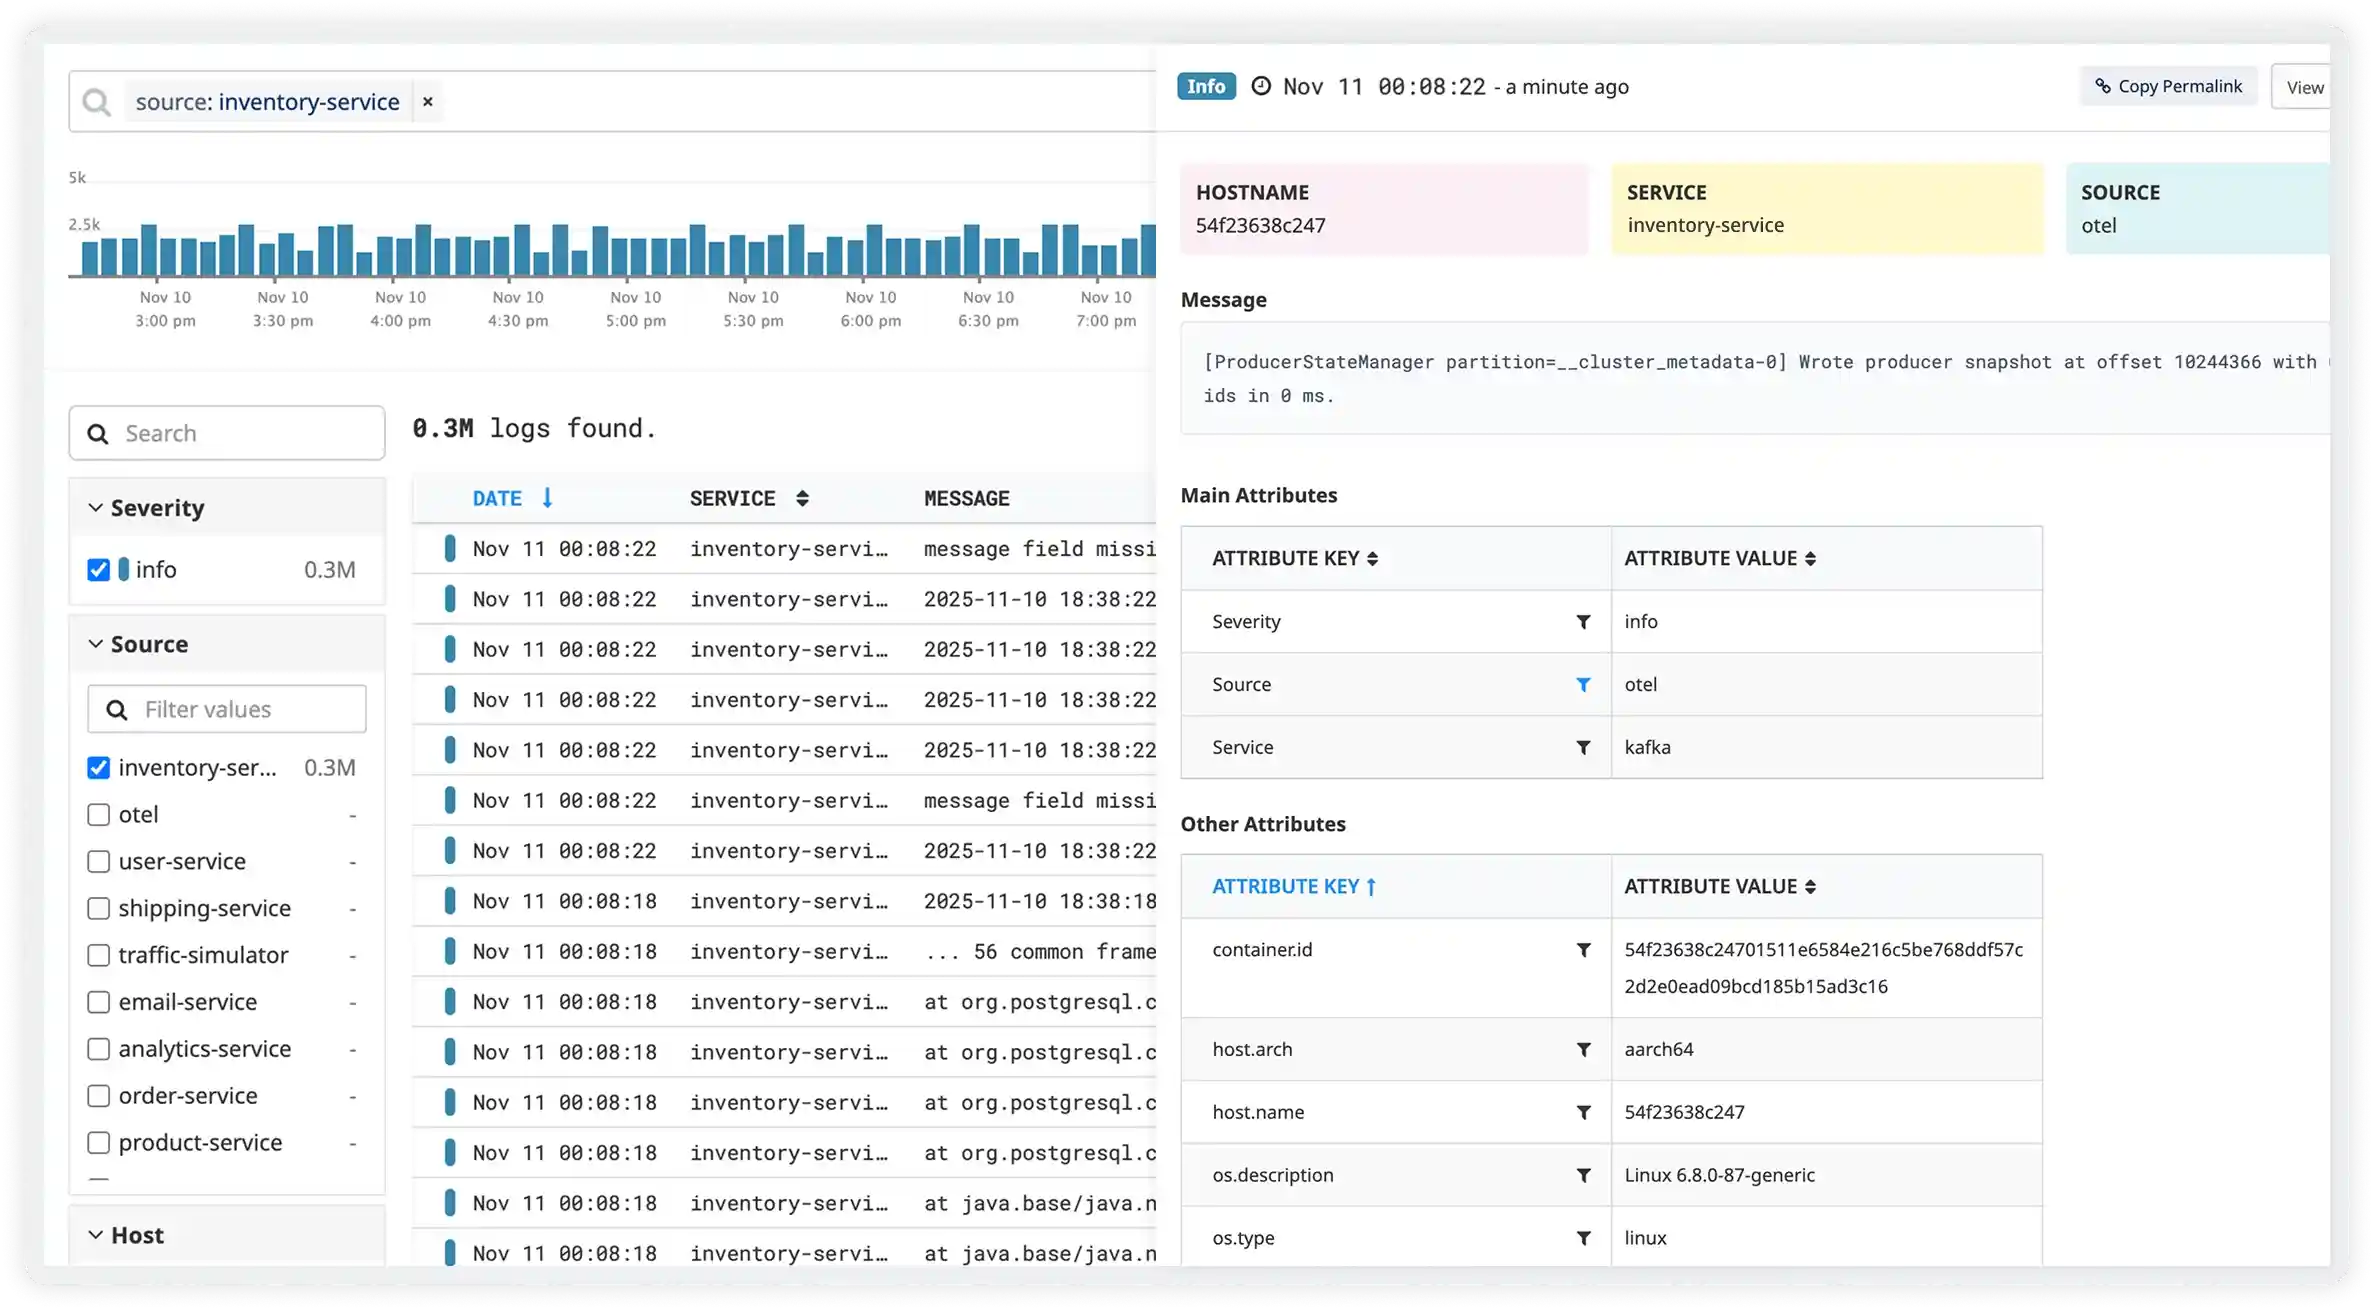
- Intuitive search bar with faceted filtering. No query language required for most investigations
- Full-text and structured field search work together in a single query
- Aggregate by any field: calculate error rates, p95 latency, throughput
- Save views and share investigations with a single URL. No "here's what I was looking at" screenshots
- Time-range controls with auto-refresh for live incident investigation
One Click from Symptom to Root Cause
Atatus automatically links log lines, traces, and metrics that share a common trace ID, request ID, or user session, so the full chain of events is one click away, not one hour away.
- Automatic correlation between logs, APM traces, and infrastructure metrics via shared trace context
- Transaction view groups related logs from multiple services in chronological order
- Instantly jump from a log error to the full distributed trace and the deployment that caused it
- Session-based correlation links logs to the specific end-user journey that triggered them
- Infrastructure event overlay. See deployments, restarts, and scaling events on the same timeline
Specific Things Atatus Does That Most Log Tools Don't
Jump from Log Line → Full Trace in One Click
Click any log error and see the complete distributed trace it belongs to - spans across every service, DB queries, external calls, and the exact line of code. No copy-pasting trace IDs between tabs.
Log Patterns - 10M Lines Reduced to 40 Templates
Atatus clusters log lines by structure, not keyword. During an incident you see 40 distinct patterns ranked by volume and error rate, not a raw firehose you have to scroll through manually.
Deploy Events on the Same Timeline as Your Logs
Every deployment, config change, and auto-scaling event is overlaid directly on your log volume and error rate graphs. Spot the correlation between a deploy and an error spike in seconds, not by asking in Slack.
Transaction View: One User Journey, All Services
Group all logs for a single checkout, API call, or background job across every service it touched, ordered by timestamp. See exactly where it spent time, where it errored, and what the state was at each step.
Live Tail with Field Filtering
Stream logs live with real-time filters on any field: user_id, order_id, http.status >= 500. Watch exactly what a specific user or request is doing right now, without spinning up a terminal session.
Log-to-Metric: Build SLOs from Your Own Log Data
Define a metric from any log query. e.g., count of checkout_success events per minute and track it as a time-series. Build SLO dashboards directly from logs without a separate metrics pipeline.
Unified Observability for Every Engineering Team
Atatus adapts to how engineering teams work across development, operations, and reliability.
Developers
Trace requests, debug errors, and identify performance issues at the code level with clear context.
DevOps
Track deployments, monitor infrastructure impact, and understand how releases affect application stability.
Release Engineer
Measure service health, latency, and error rates to maintain reliability and reduce production risk.
Milestones that spark performance excellence
Reflections from clients who've achieved unmatched excellence through innovative strategies.
Read customer stories


