Eliminate Slow Queries While Maintaining High Concurrency
Boost MariaDB efficiency by fine-tuning queries, ensuring optimal performance without compromising your database's health.
MariaDB Database Monitoring
Query Execution Analysis
Analyzes slow queries and execution behavior specific to MariaDB query optimizer.
Thread Pool Utilization
Monitors thread pool activity affecting concurrent query processing.
Replication Delay
Measures replication lag in MariaDB primary-replica configurations.
Storage Engine Metrics
Tracks InnoDB and Aria engine behavior under transactional workloads.
Lock Contention
Detects row and table locks impacting write throughput.
Disk IO Behavior
Monitors read/write latency and fsync operations.
Error Log Tracking
Surfaces MariaDB errors related to crashes and replication.
Resource Consumption
Tracks CPU and memory usage across MariaDB processes.
Real-Time MariaDB Query Hotspot and Replication Performance Analysis
Expose costly operations, workload surges, and consistency risks early.
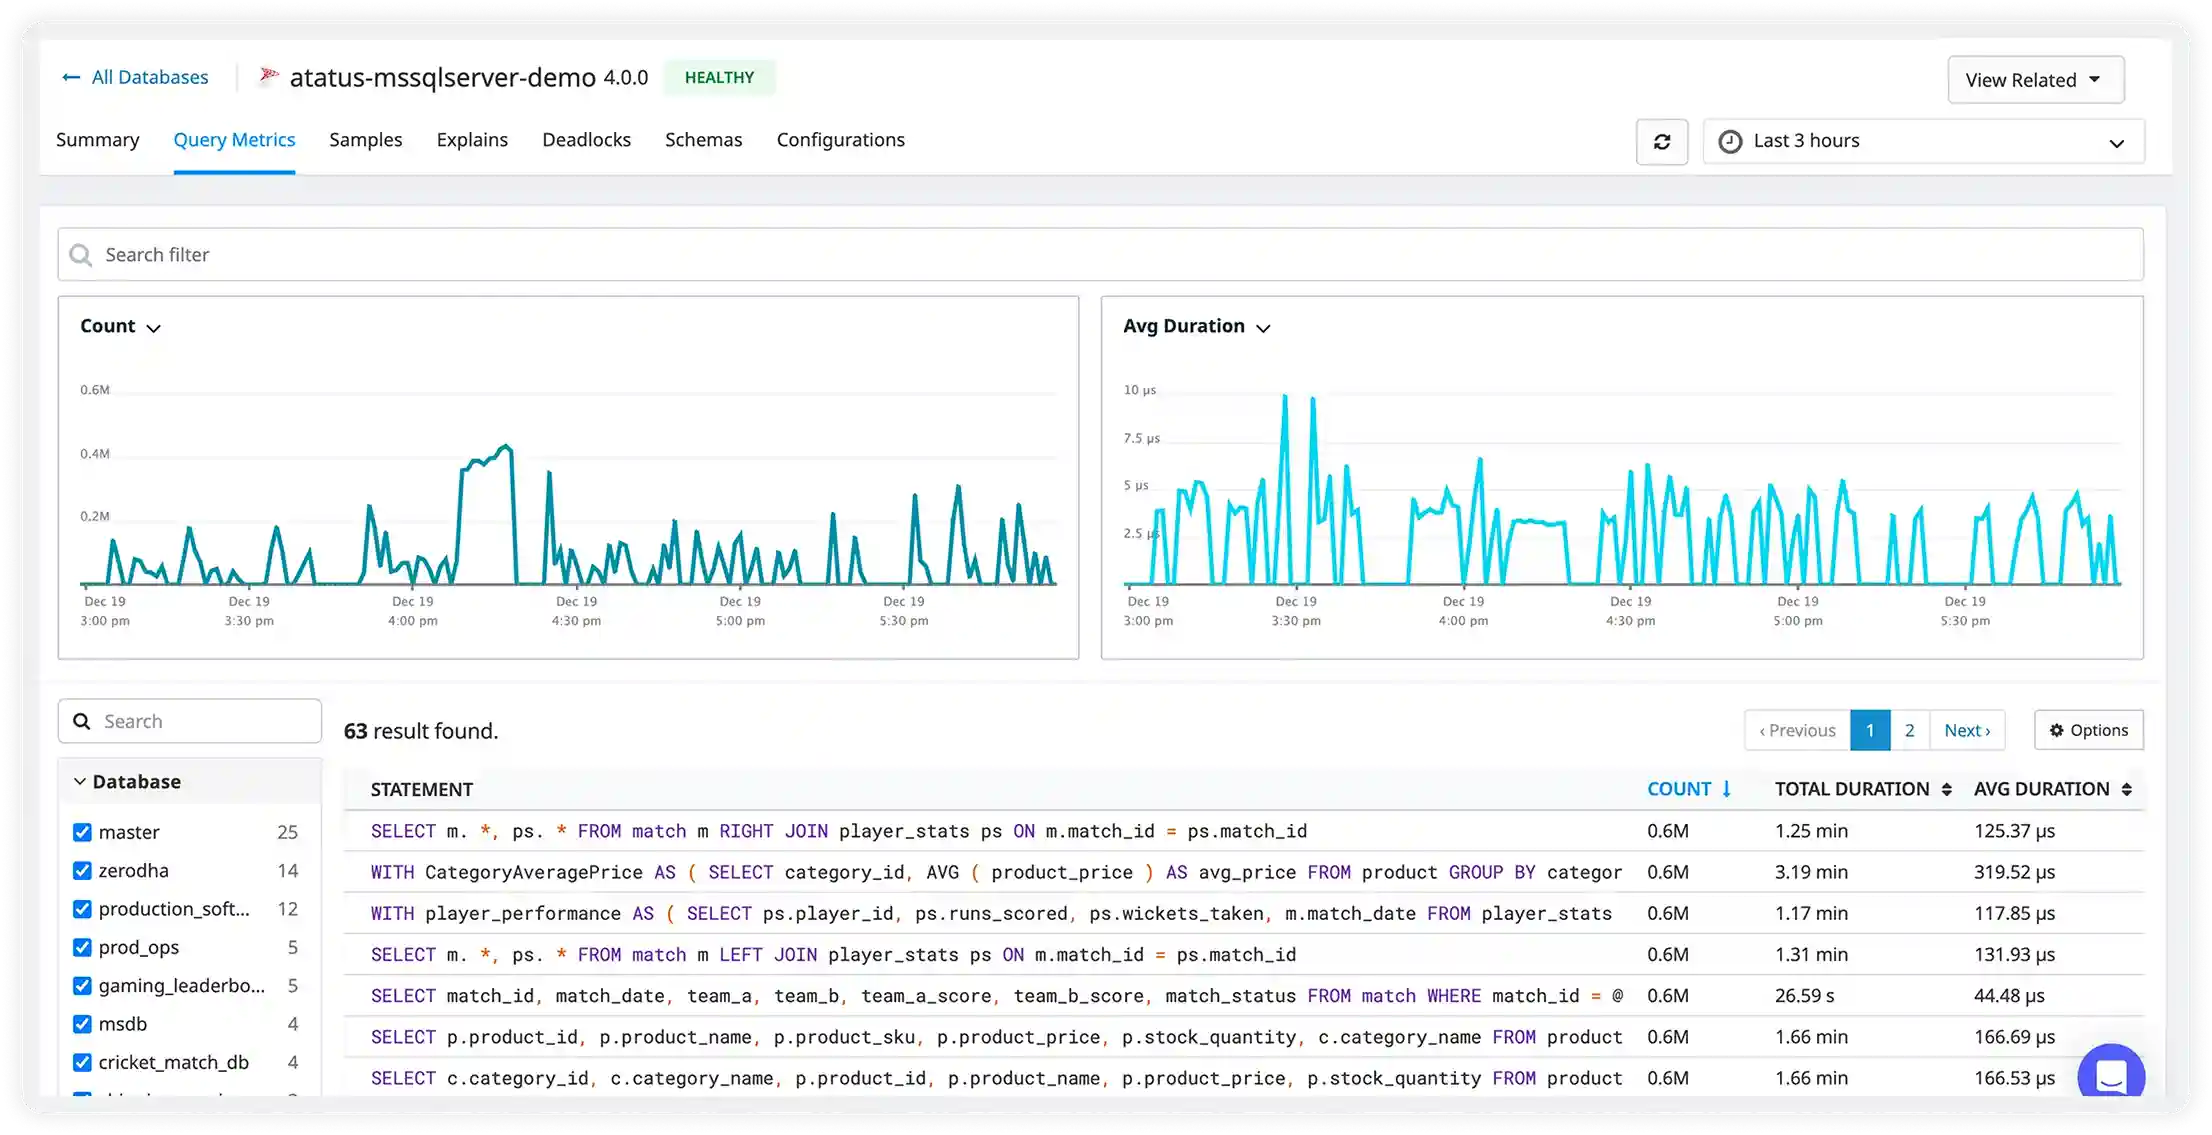
Query Load Patterns & Performance Hotspots
- Break down total database workload by query type, operation category, and execution frequency to clearly reveal the heaviest performance consumers in production.
- Track response time trends across peak traffic hours, background jobs, and reporting workloads to understand when and why slowdowns occur.
- Identify resource-intensive queries and operations that consume excessive CPU, memory, or disk I/O and reduce overall throughput.
- Monitor workload growth over time as applications scale to proactively plan capacity and prevent performance degradation.
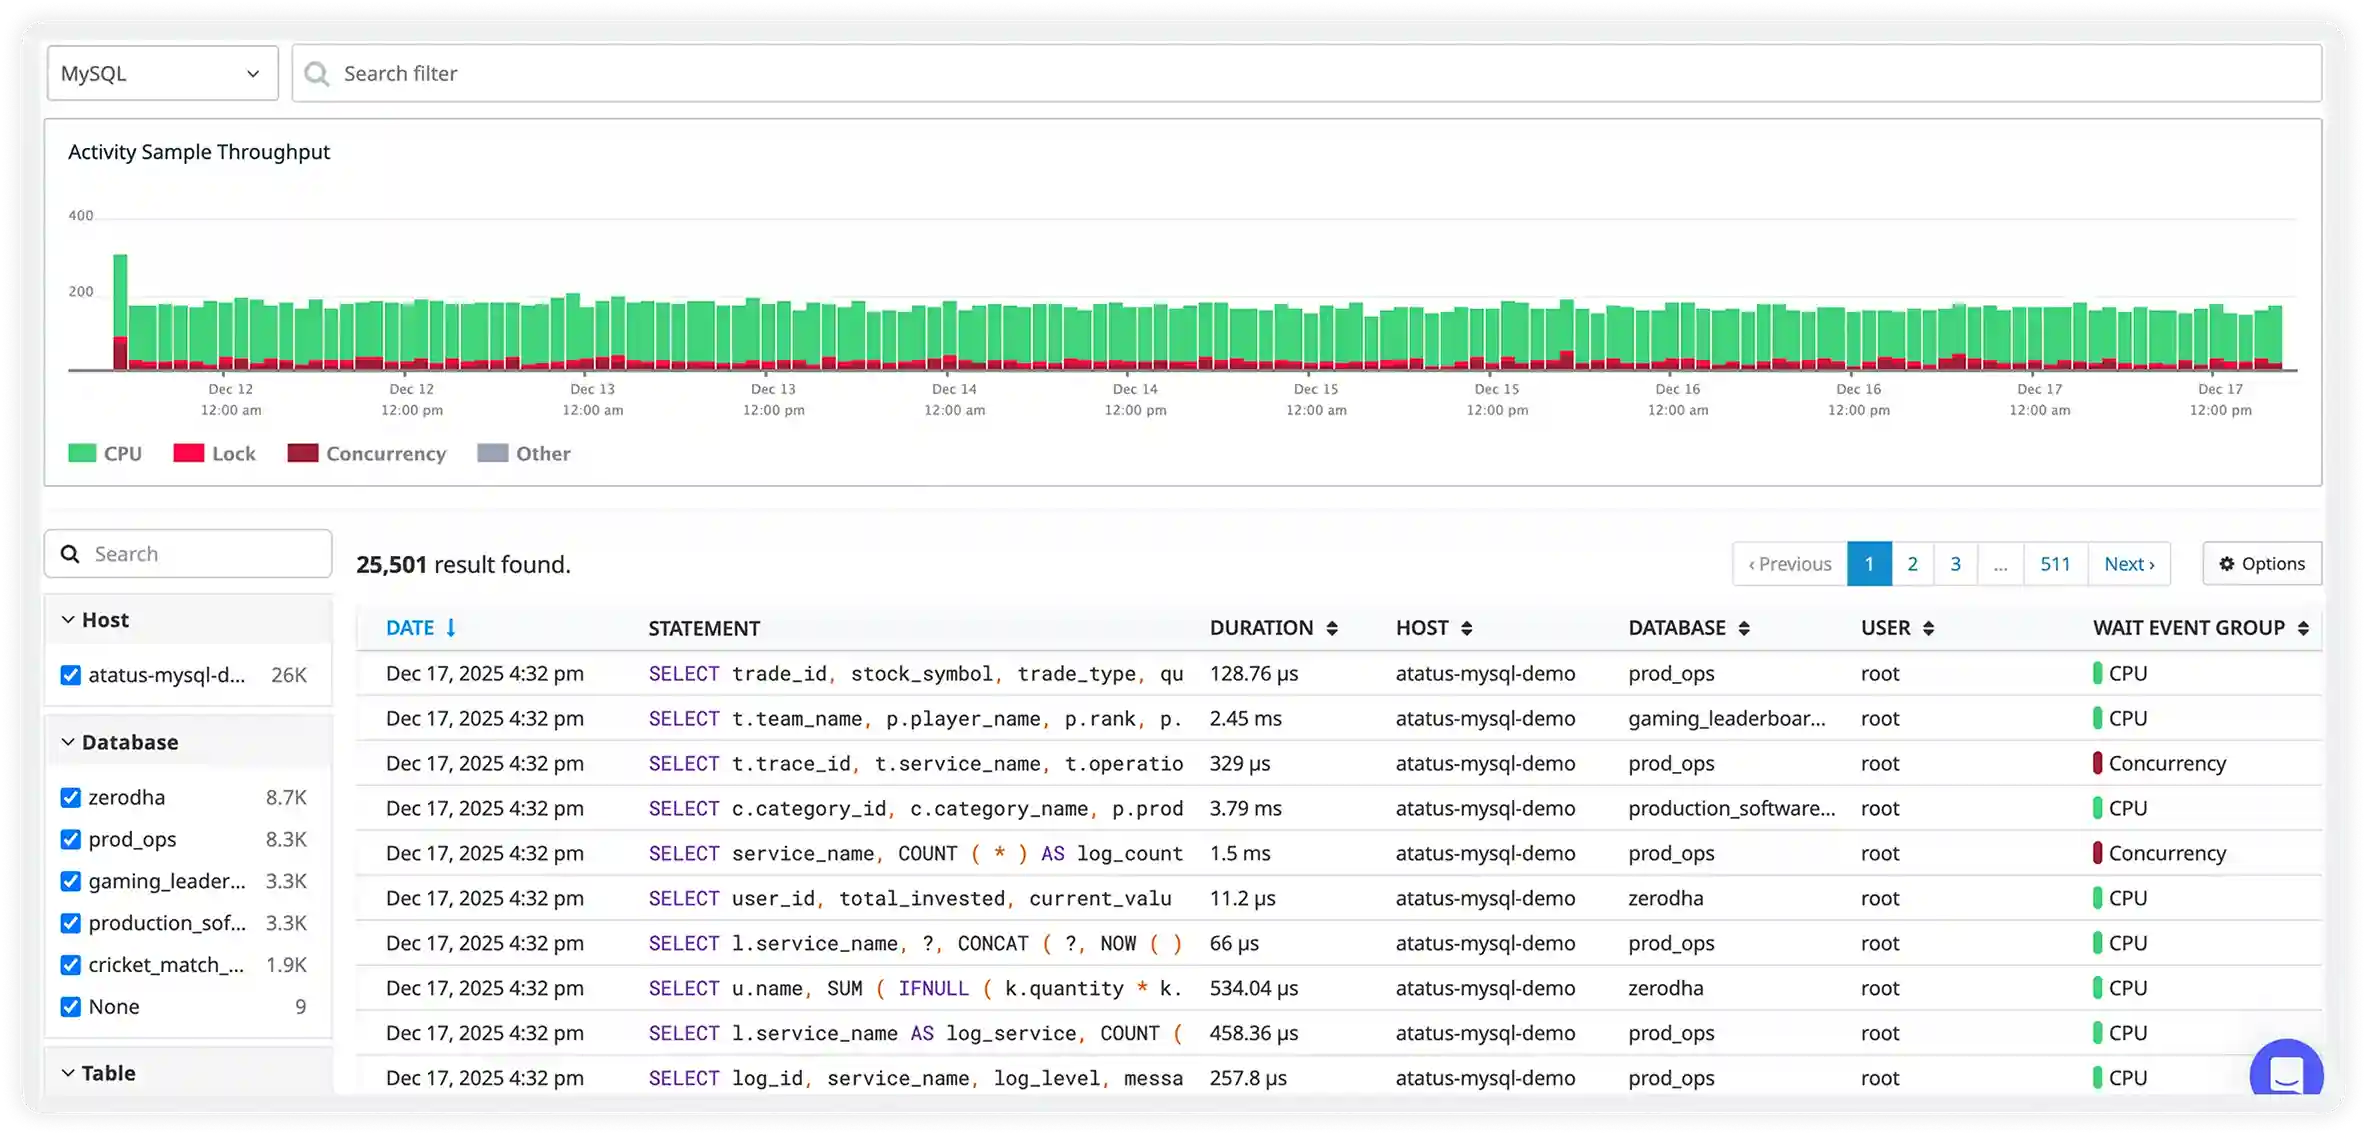
Real-Time SQL Flow & Costly Operations
- Capture active SQL statements in real time along with execution duration, database context, and client source for complete workload visibility.
- Instantly surface slow joins, heavy insert operations, bulk updates, and complex queries that impact responsiveness.
- Filter live activity by database, table, service, or user to quickly isolate performance bottlenecks.
- Understand how real production traffic interacts with your data layer to optimize high-impact application paths.
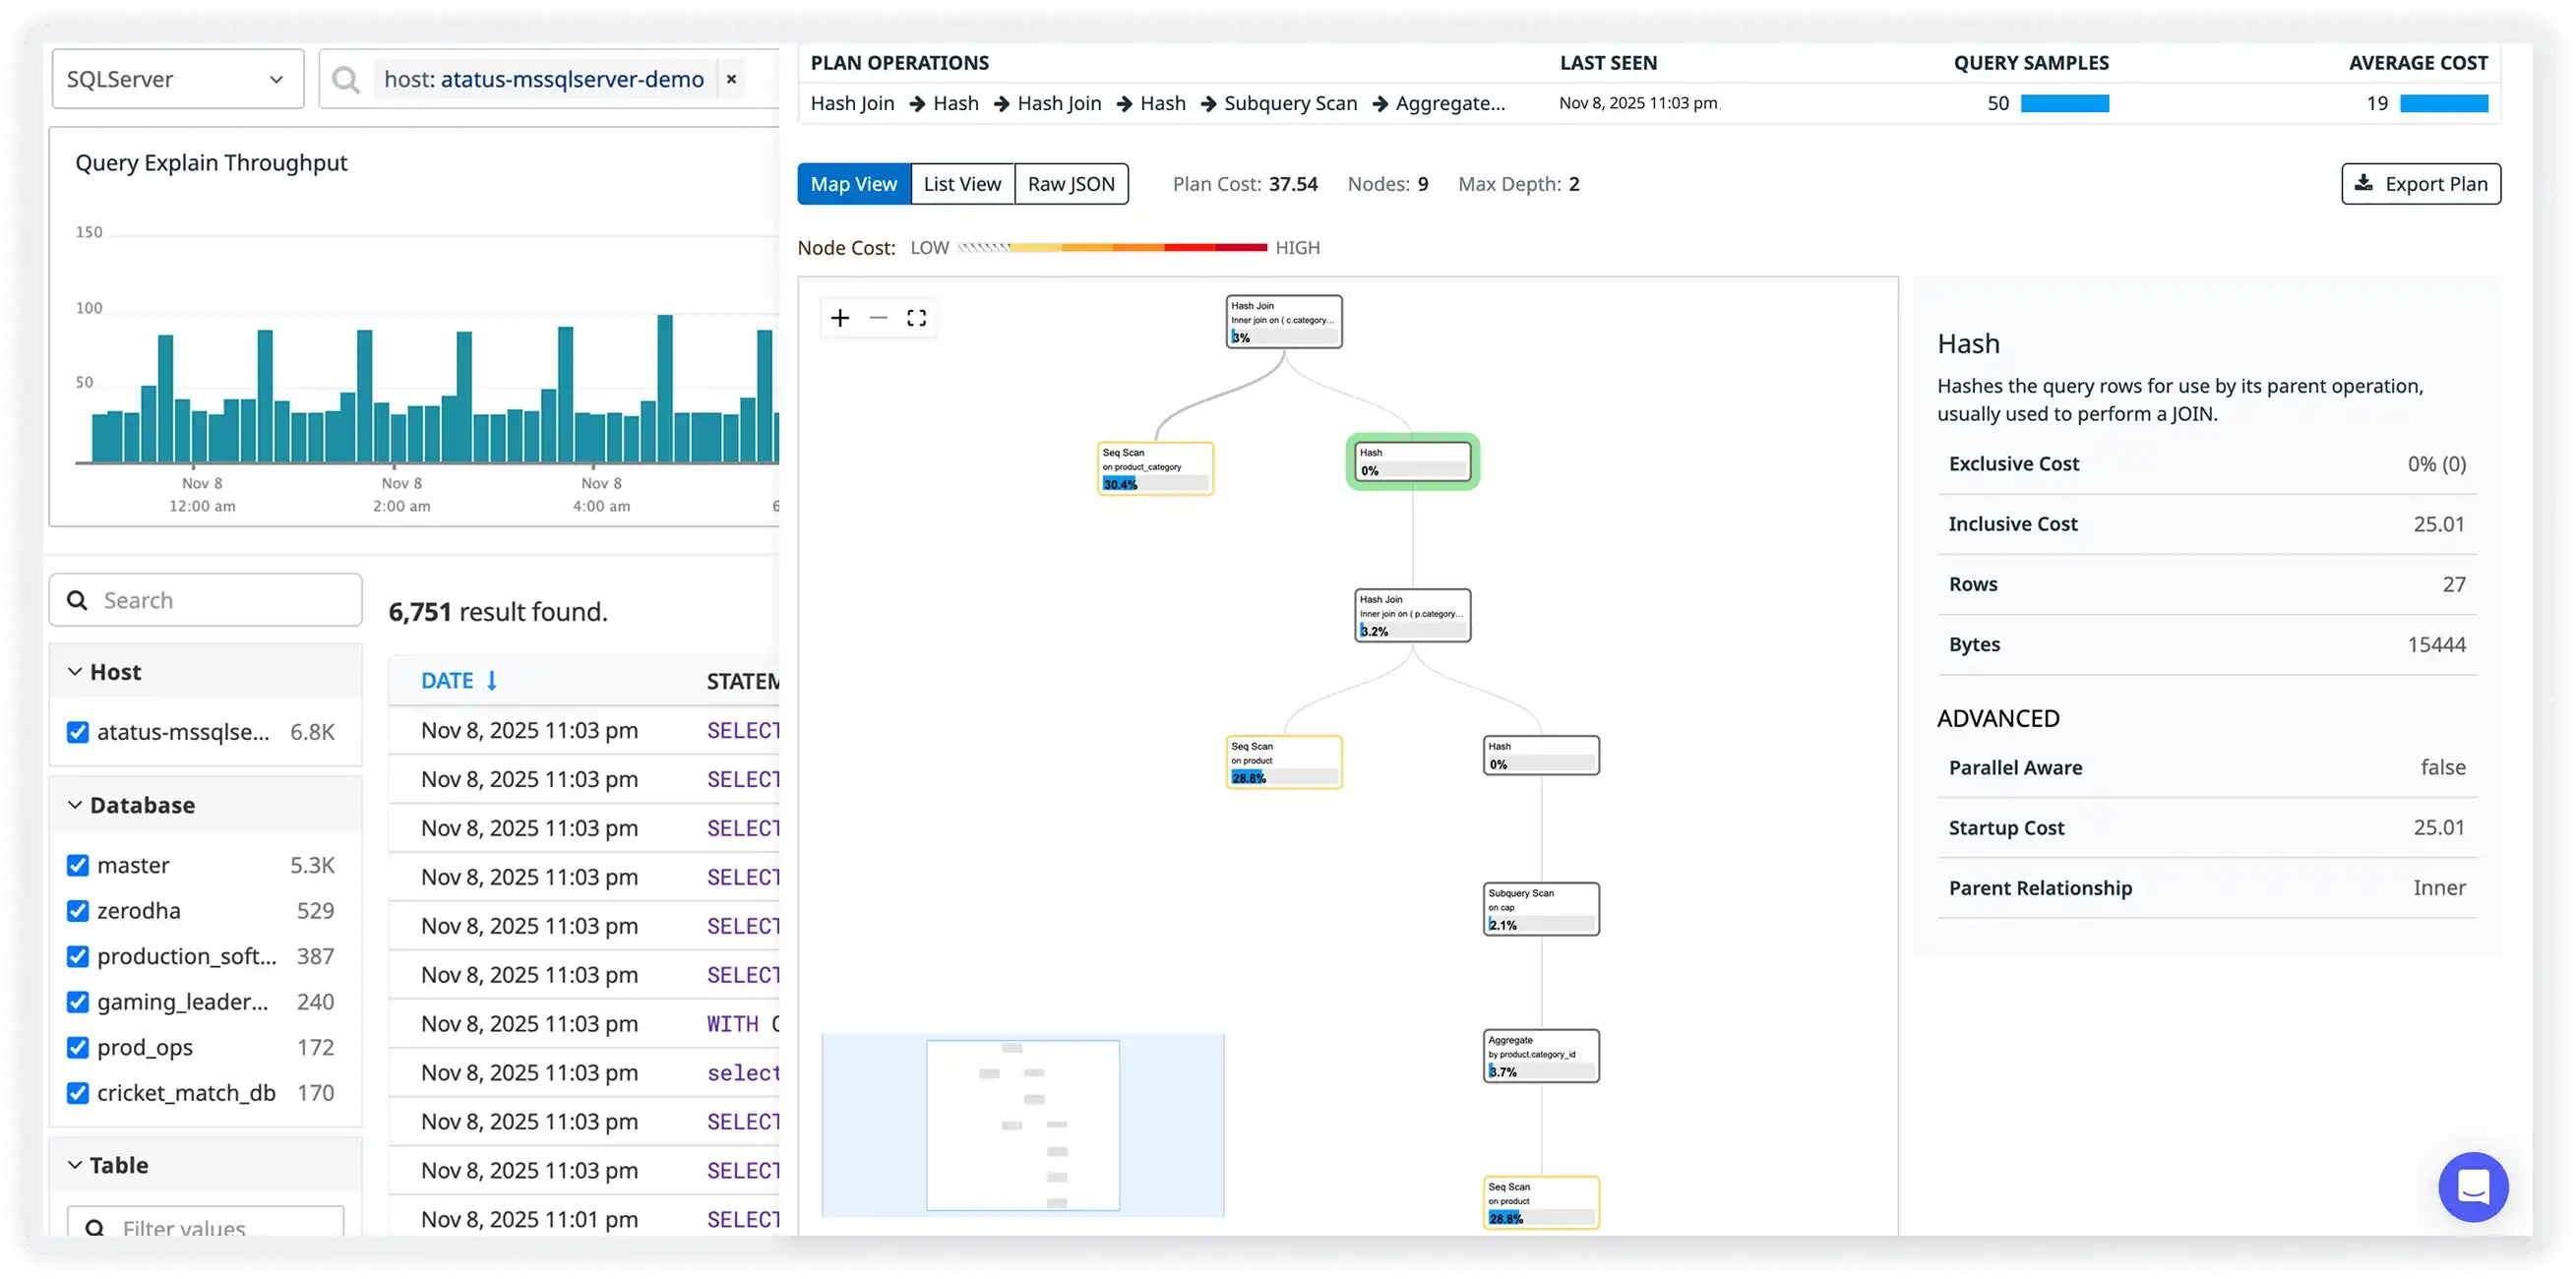
Execution Plans & Index Strategy Insights
- Visualize MariaDB optimizer decisions across joins, scans, and index access paths to understand how queries are executed internally.
- Detect full table scans and inefficient index usage early before they lead to performance slowdowns.
- Analyze operation-level cost distribution to prioritize tuning efforts where they deliver the most impact.
- Improve query speed and efficiency using real execution behavior rather than theoretical optimization.
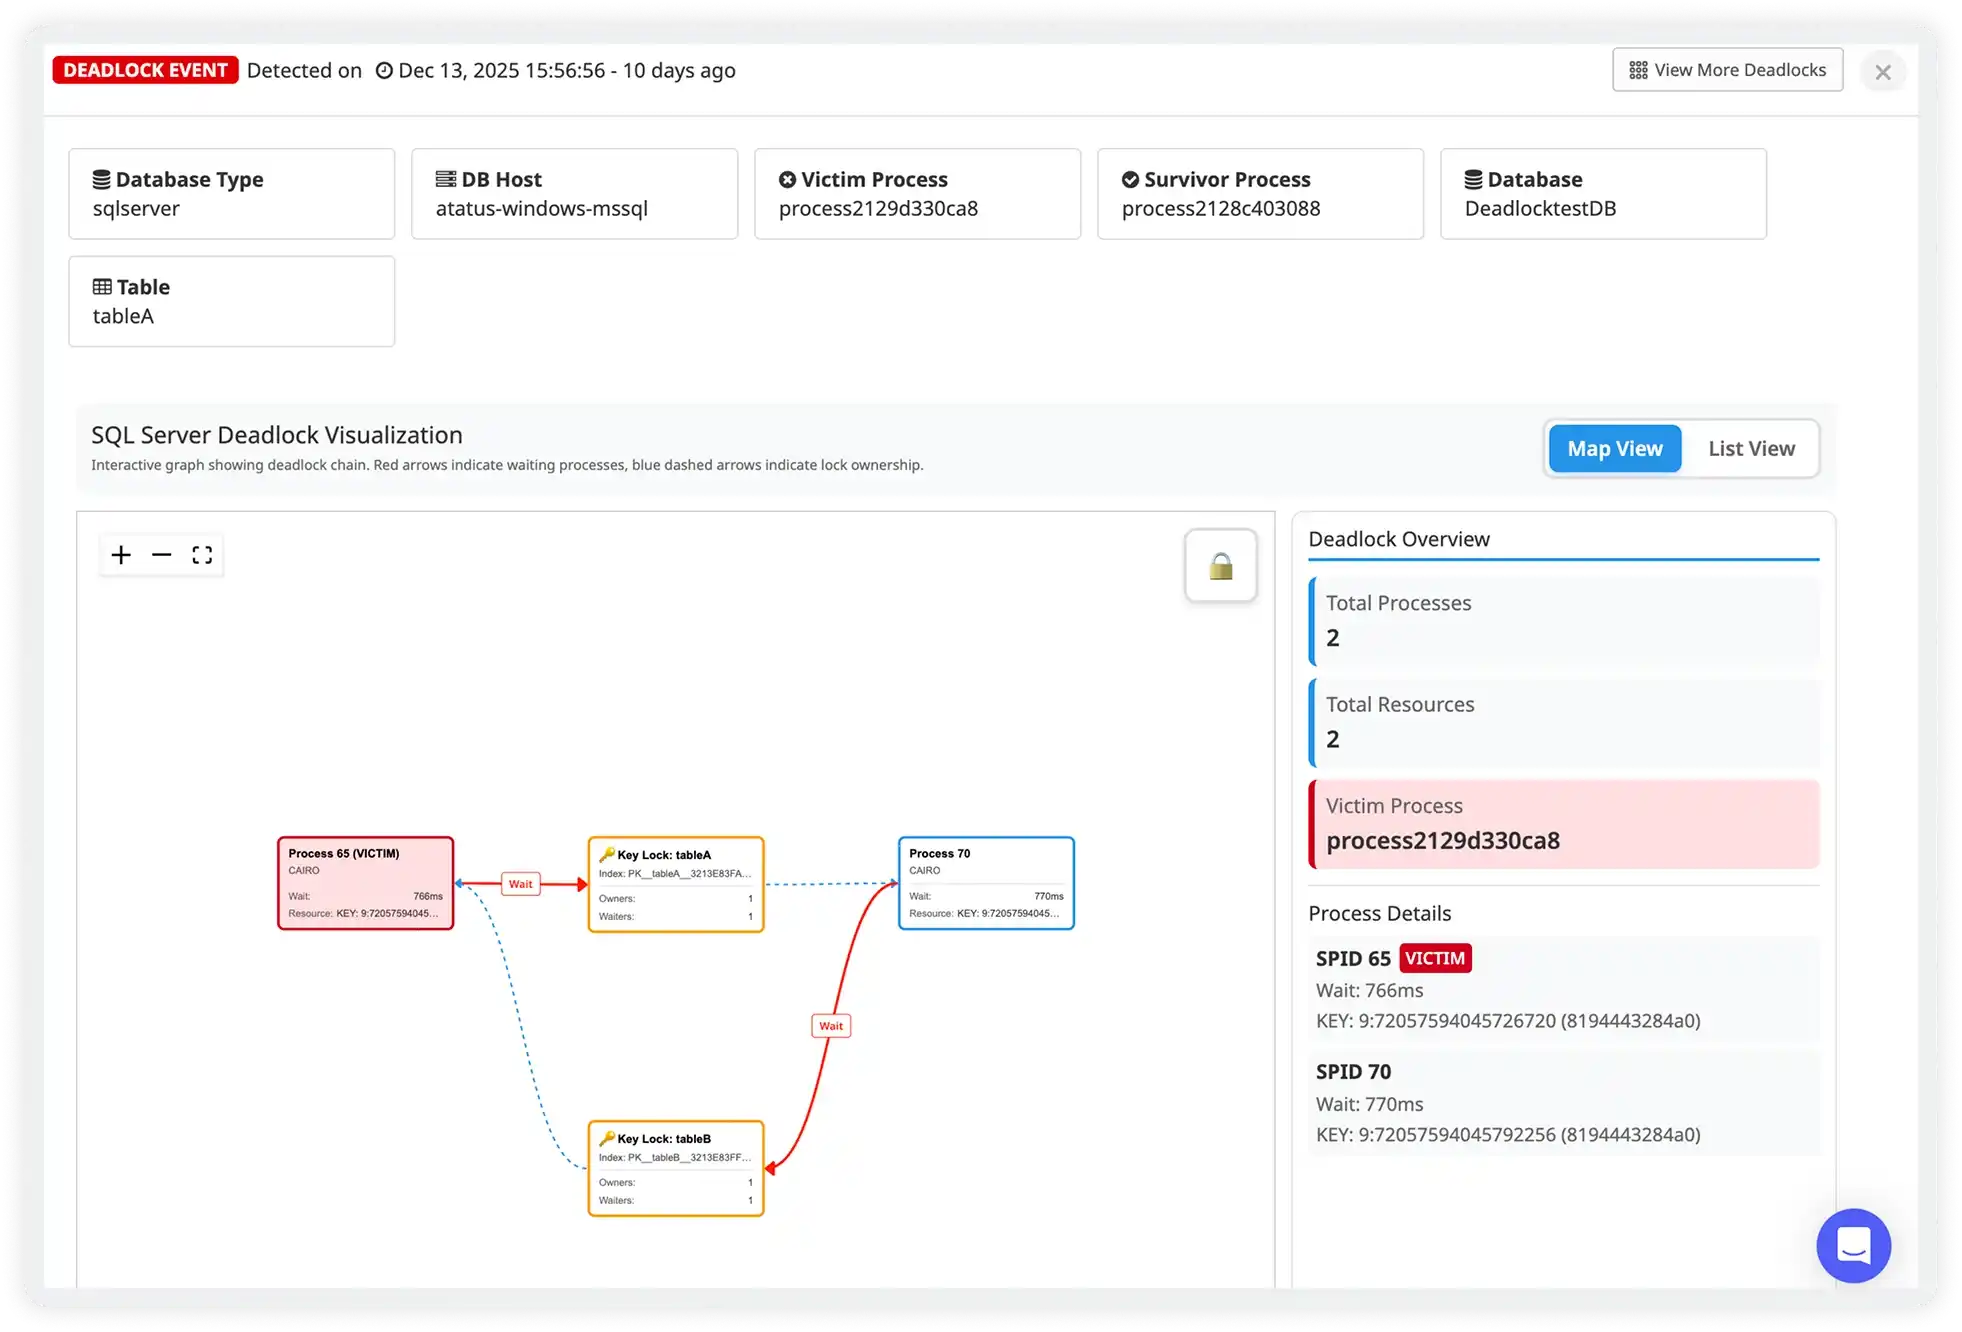
Replication Lag, Write Pressure & Consistency Health
- Track primary to replica synchronization status in real time to ensure healthy replication performance.
- Monitor replication delay that impacts read scaling and data freshness across replicas.
- Identify heavy write bursts or long-running transactions that slow down replication pipelines.
- Maintain data consistency and high availability during traffic spikes and peak workload periods.
Why choose Atatus for MariaDB database monitoring?
Faster query performance
Atatus helps you identify inefficient SQL and optimizer decisions to reduce query latency.
Improved concurrency handling
Atatus provides visibility into thread pool behavior to maintain performance under heavy load.
Reliable replication stability
Atatus monitors replica lag and sync issues to prevent data inconsistency.
Stable storage performance
Atatus tracks engine behavior to keep transactional workloads running smoothly.
Reduced write bottlenecks
Atatus detects lock contention early to avoid production slowdowns.
Smarter capacity planning
Atatus correlates database activity with system resources to plan scaling confidently.
Unified Observability for Every Engineering Team
Atatus adapts to how engineering teams work across development, operations, and reliability.
Developers
Trace requests, debug errors, and identify performance issues at the code level with clear context.
DevOps
Track deployments, monitor infrastructure impact, and understand how releases affect application stability.
Release Engineer
Measure service health, latency, and error rates to maintain reliability and reduce production risk.