Eliminate Query Bottlenecks and Deadlocks Before They Disrupt Users
Detect and resolve sluggish Microsoft SQL Server queries in your requests, along with transaction traces, to gather actionable insights for optimized functionality.
MS SQL Database Monitoring
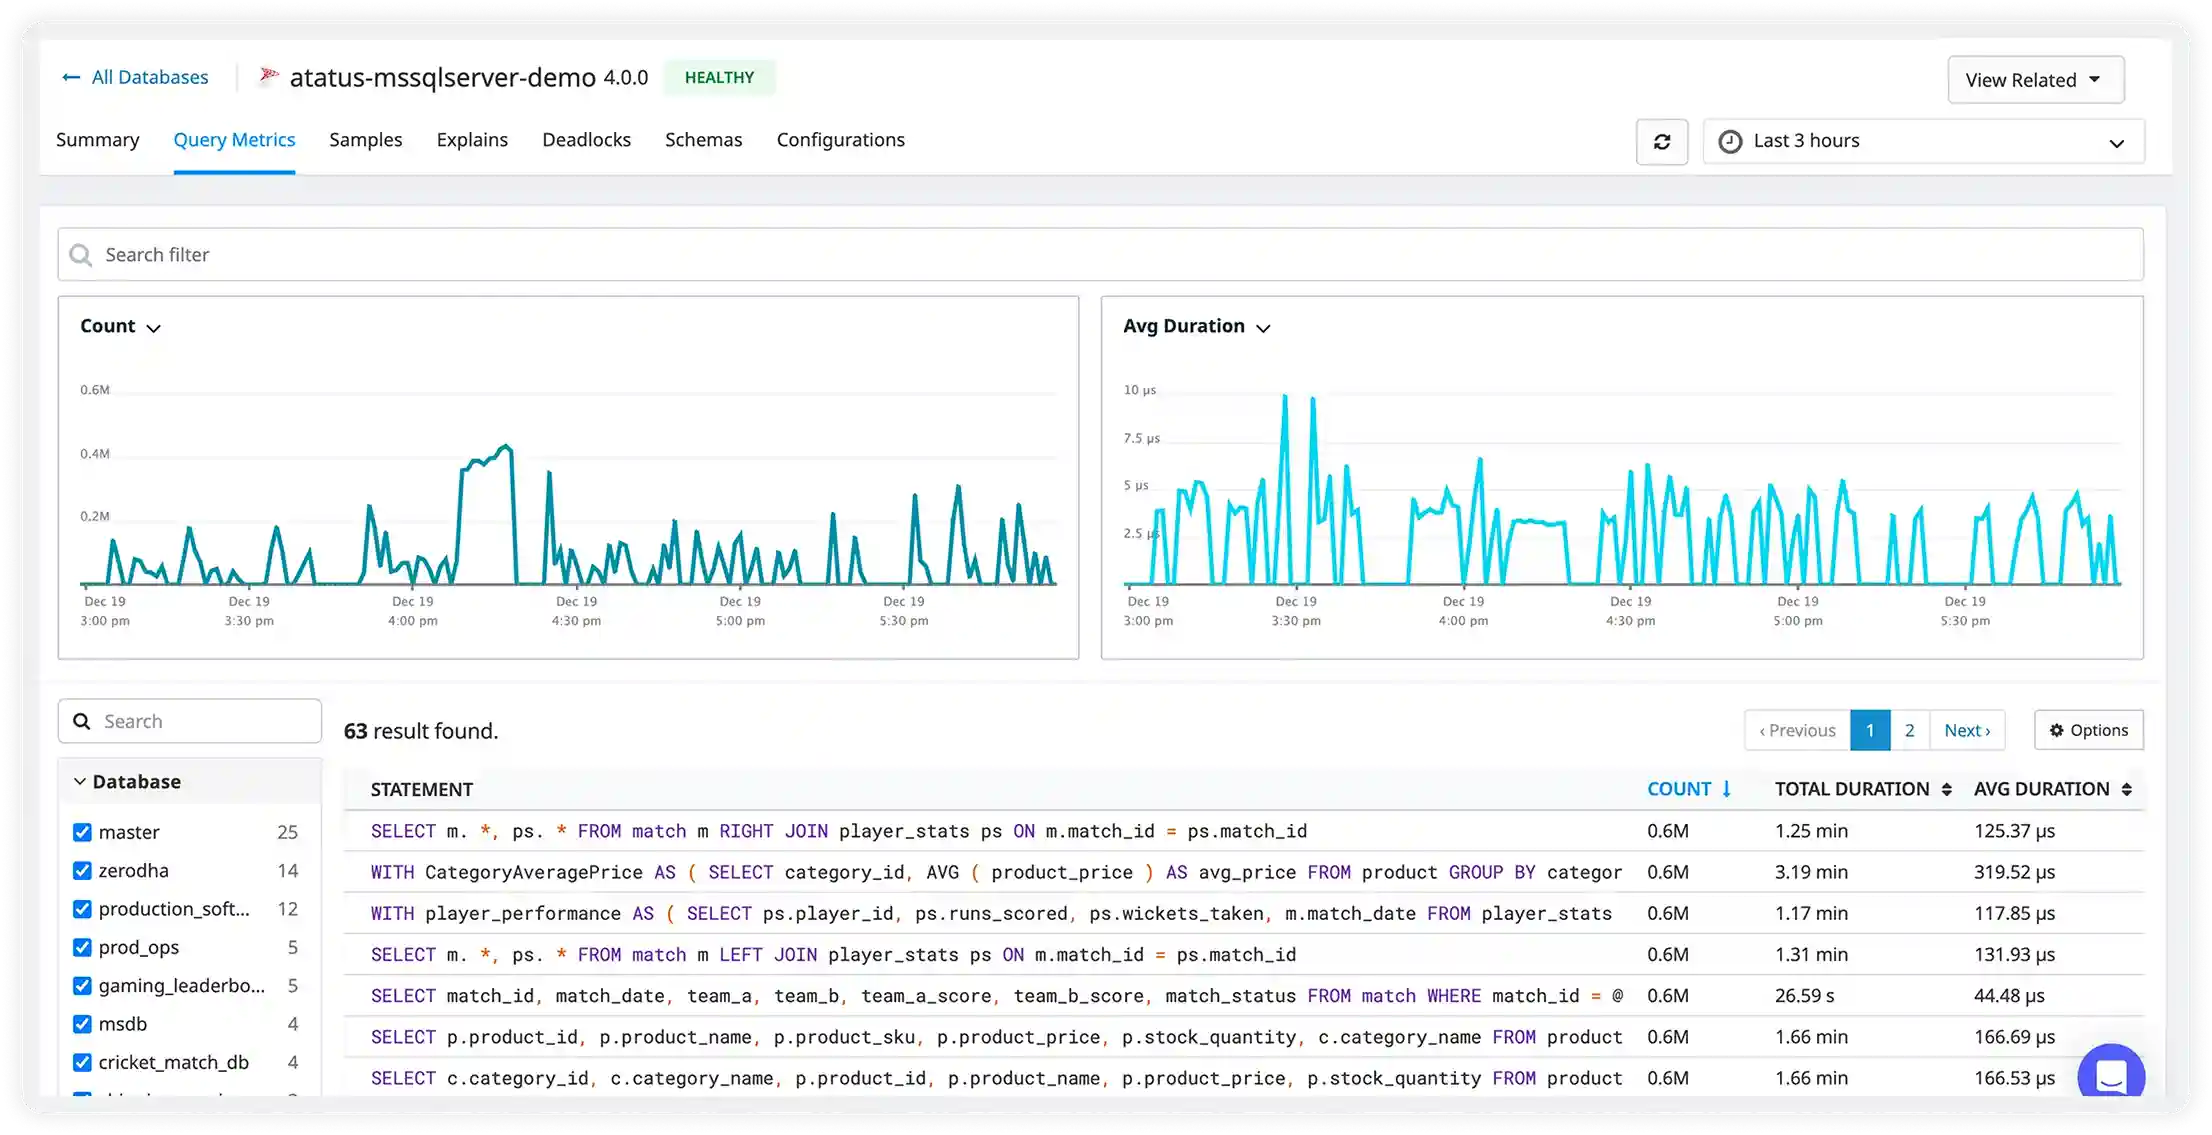
Query Performance Metrics
Analyzes execution plans, wait statistics, and index efficiency in SQL Server.
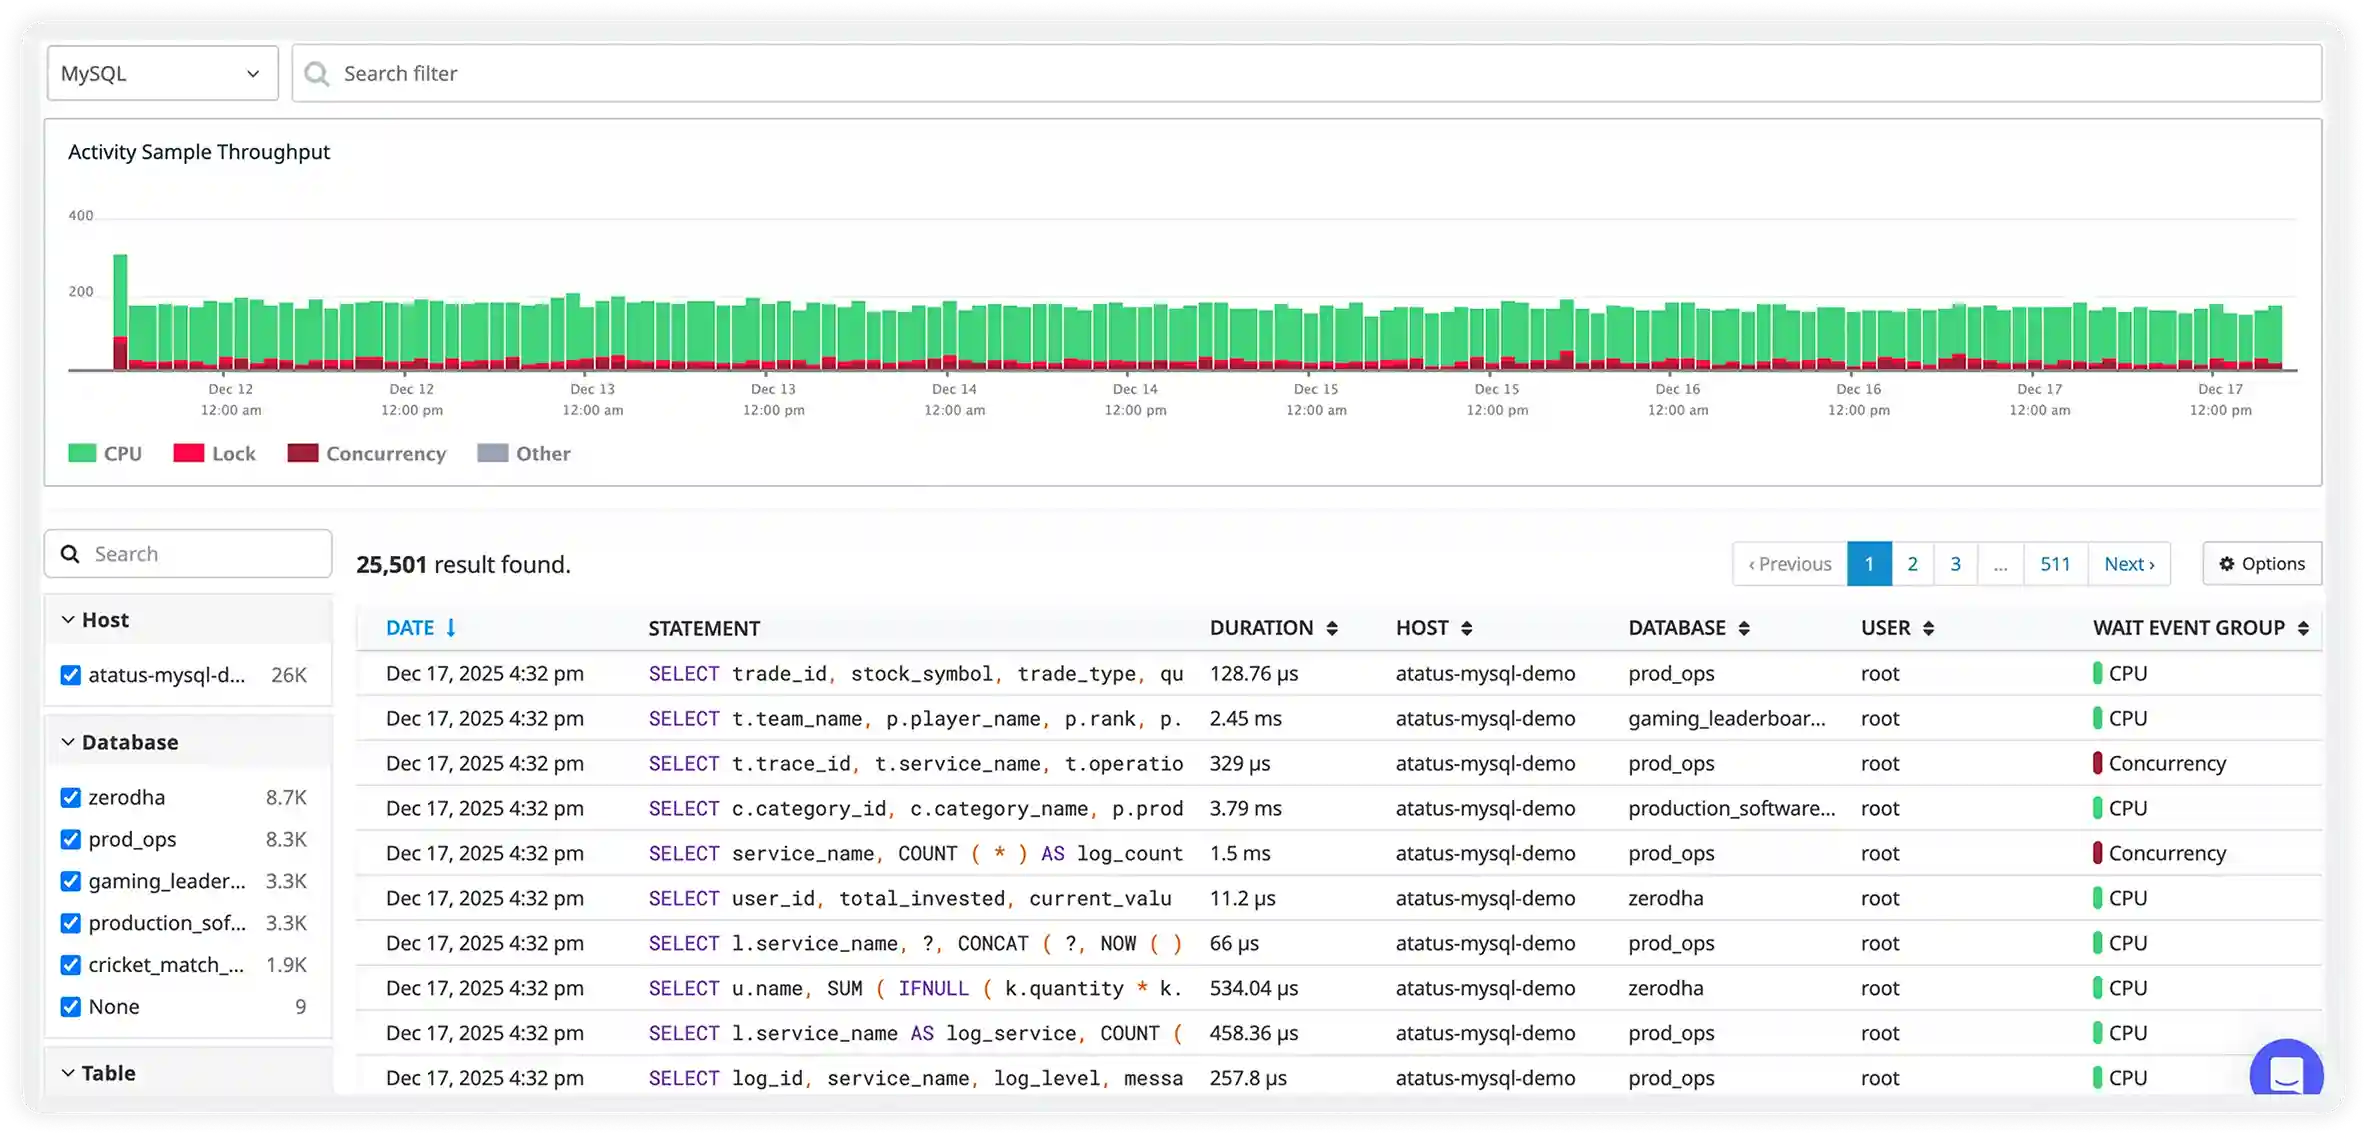
Lock and Deadlock Tracking
Monitors blocking chains and deadlock graphs affecting concurrent workloads.
Thread and Session Load
Tracks worker thread usage and active sessions under high concurrency.
TempDB Utilization
Monitors TempDB contention caused by sorting, hashing, and version store usage.
Transaction Log Growth
Tracks log file expansion and checkpoint activity affecting write throughput.
Replication and AG Health
Observes replication latency and availability group synchronization state.
Error Log Monitoring
Surfaces SQL Server errors related to crash recovery and availability.
CPU and IO Load
Analyzes SQL Server CPU and disk IO consumption patterns.
Advanced SQL Server Workload Intelligence and Execution Plan Control
Understand cost distribution, plan regressions, TempDB pressure, and throughput.
Workload Distribution & Query Cost Analysis
- Break down total database load by individual queries, stored procedures, application services, and background jobs to clearly understand how CPU, memory, and disk resources are distributed across the system in real production environments.
- Track CPU-intensive versus I/O-intensive workloads over time to identify whether performance pressure is coming from compute saturation, storage bottlenecks, or inefficient query patterns.
- Monitor query cost and resource usage trends across business hours, reporting windows, batch processing cycles, and peak traffic events to detect sustained pressure or abnormal workload shifts.
- Proactively identify inefficient queries, growing execution costs, and abnormal workload spikes before they degrade performance, impact SLAs, or affect critical application workflows.
Stored Procedures, Ad-Hoc SQL & Runtime Behavior
- Capture real-time execution details of stored procedures, parameterized queries, and dynamic SQL statements to gain complete visibility into how workloads behave under live traffic.
- Instantly surface procedures and ad-hoc SQL statements that slow down due to data growth, parameter skew, execution plan changes, blocking, or resource contention.
- Analyze parameter usage patterns, execution frequency, and runtime variability to detect performance inconsistencies caused by parameter sniffing or uneven data distribution.
- Diagnose performance issues tied to specific application services, integrations, scheduled jobs, or user-driven workloads with clear context.
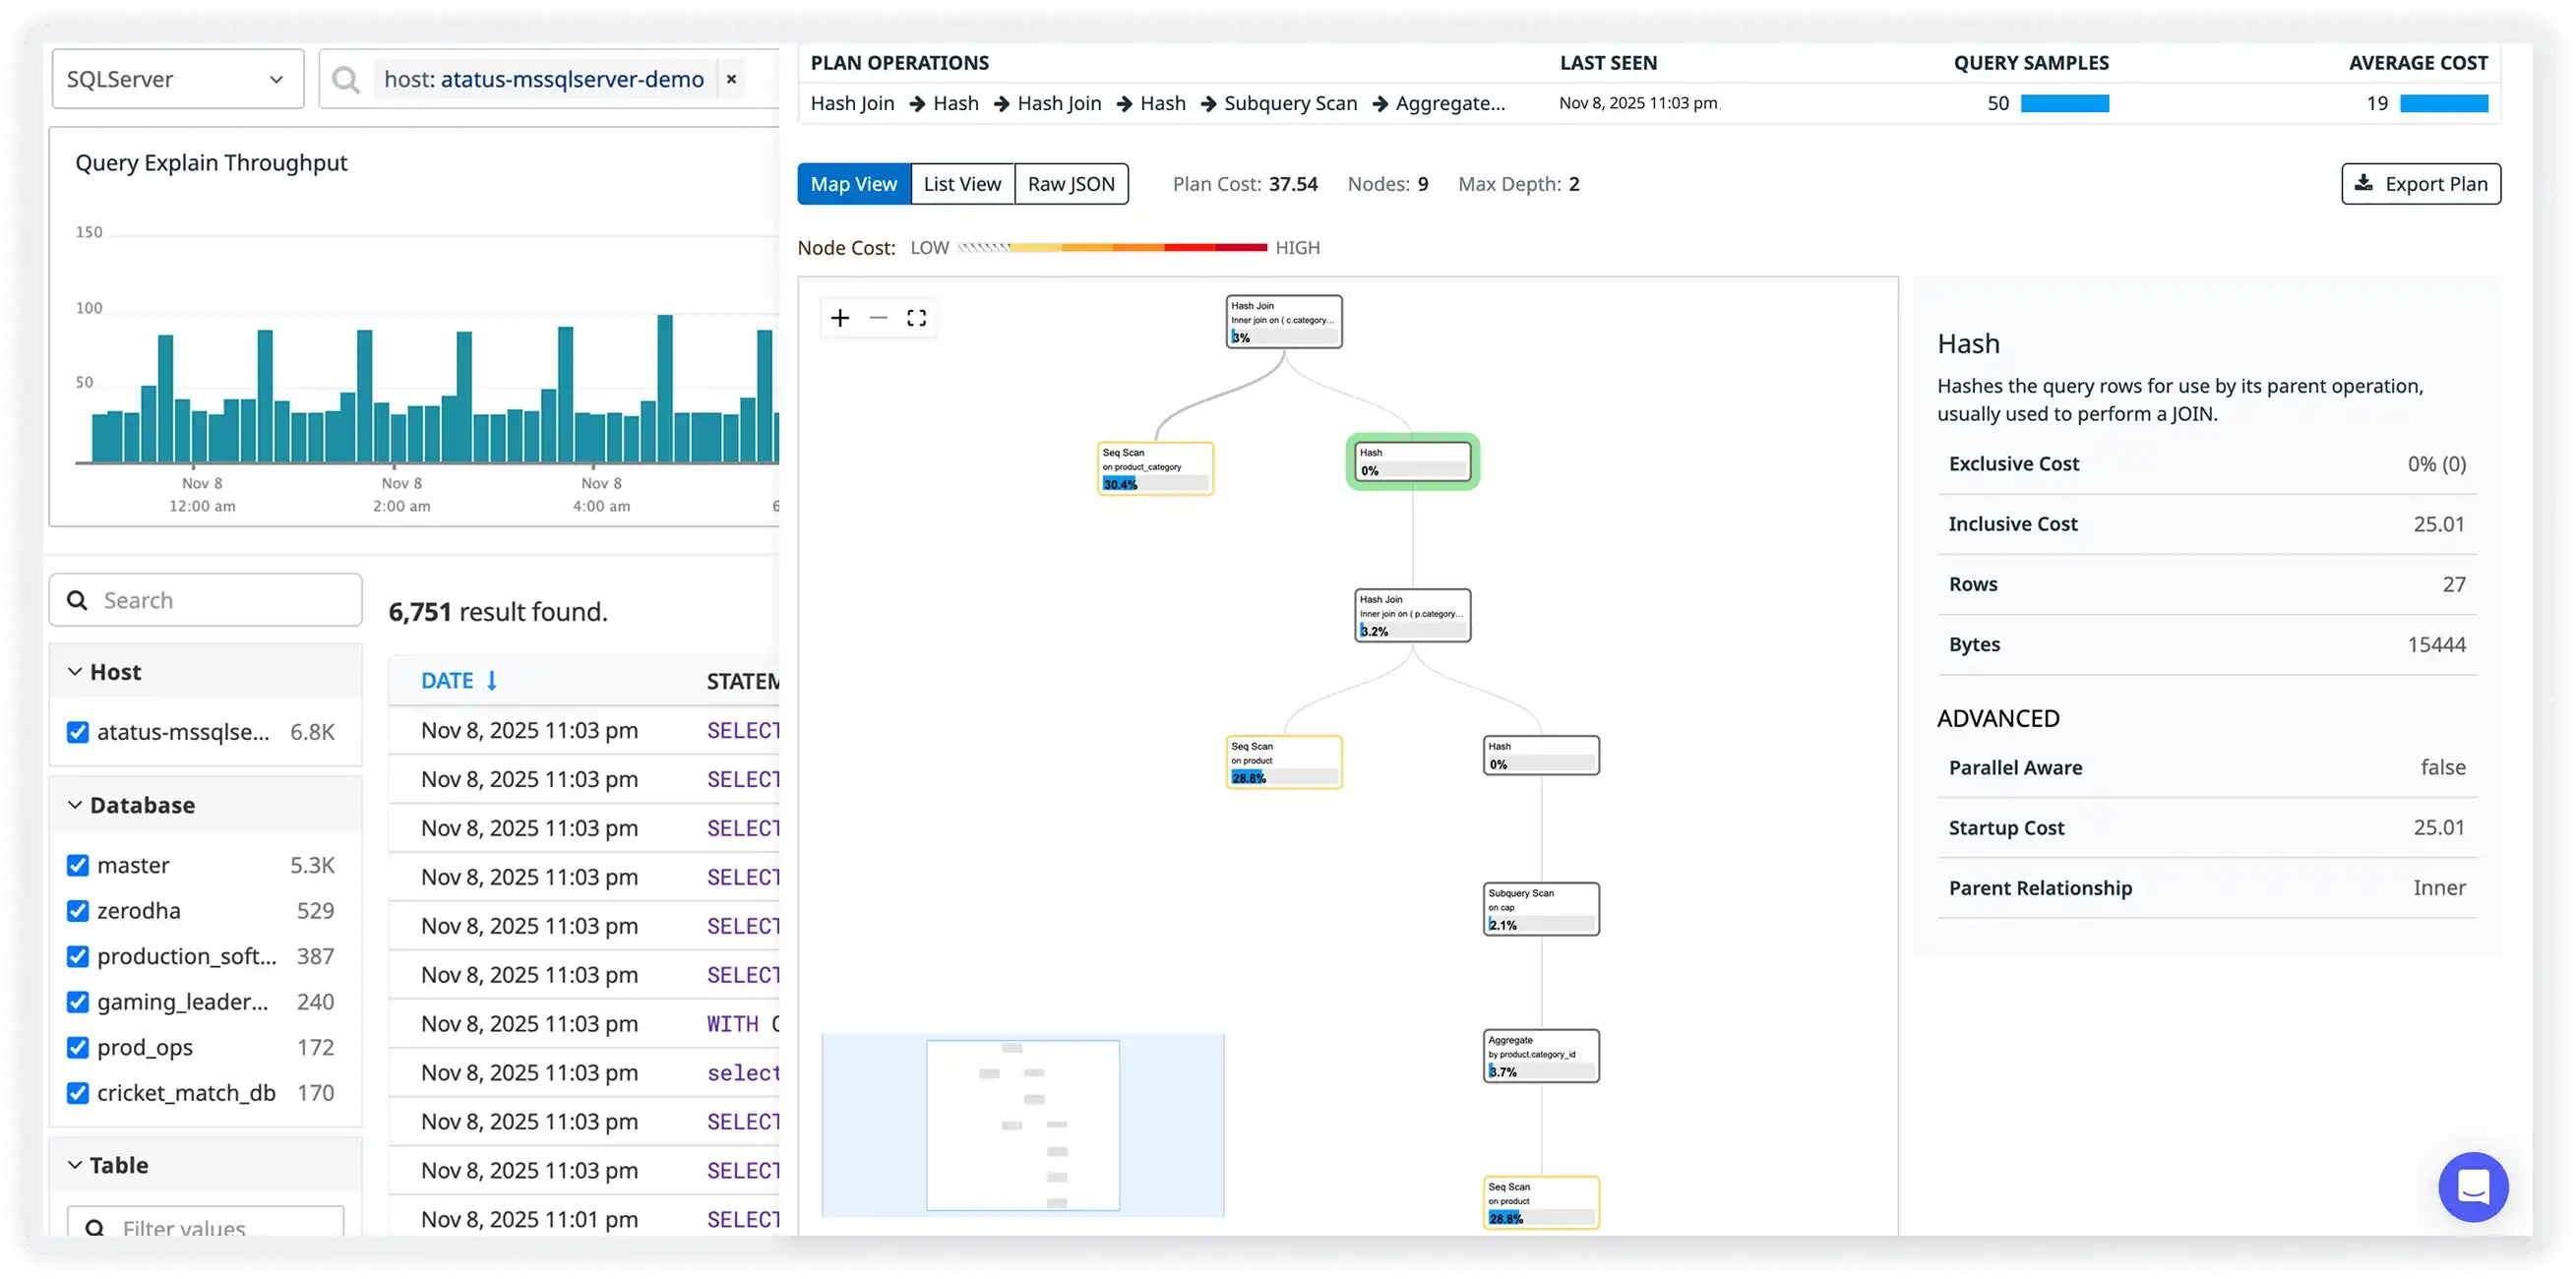
Plan Cache, Recompiles & Execution Strategy
- Visualize cached execution plans used by SQL Server to understand how queries and procedures are optimized and executed internally across workloads.
- Detect frequent recompiles, execution plan regressions, parameter sniffing side effects, and plan instability that cause sudden performance fluctuations.
- Analyze join strategies, parallelism decisions, memory grants, operator-level costs, and spill behavior to pinpoint inefficiencies inside complex execution plans.
- Stabilize and optimize performance by tuning indexing strategies, query structure, statistics updates, and plan reuse behavior for consistent execution efficiency.
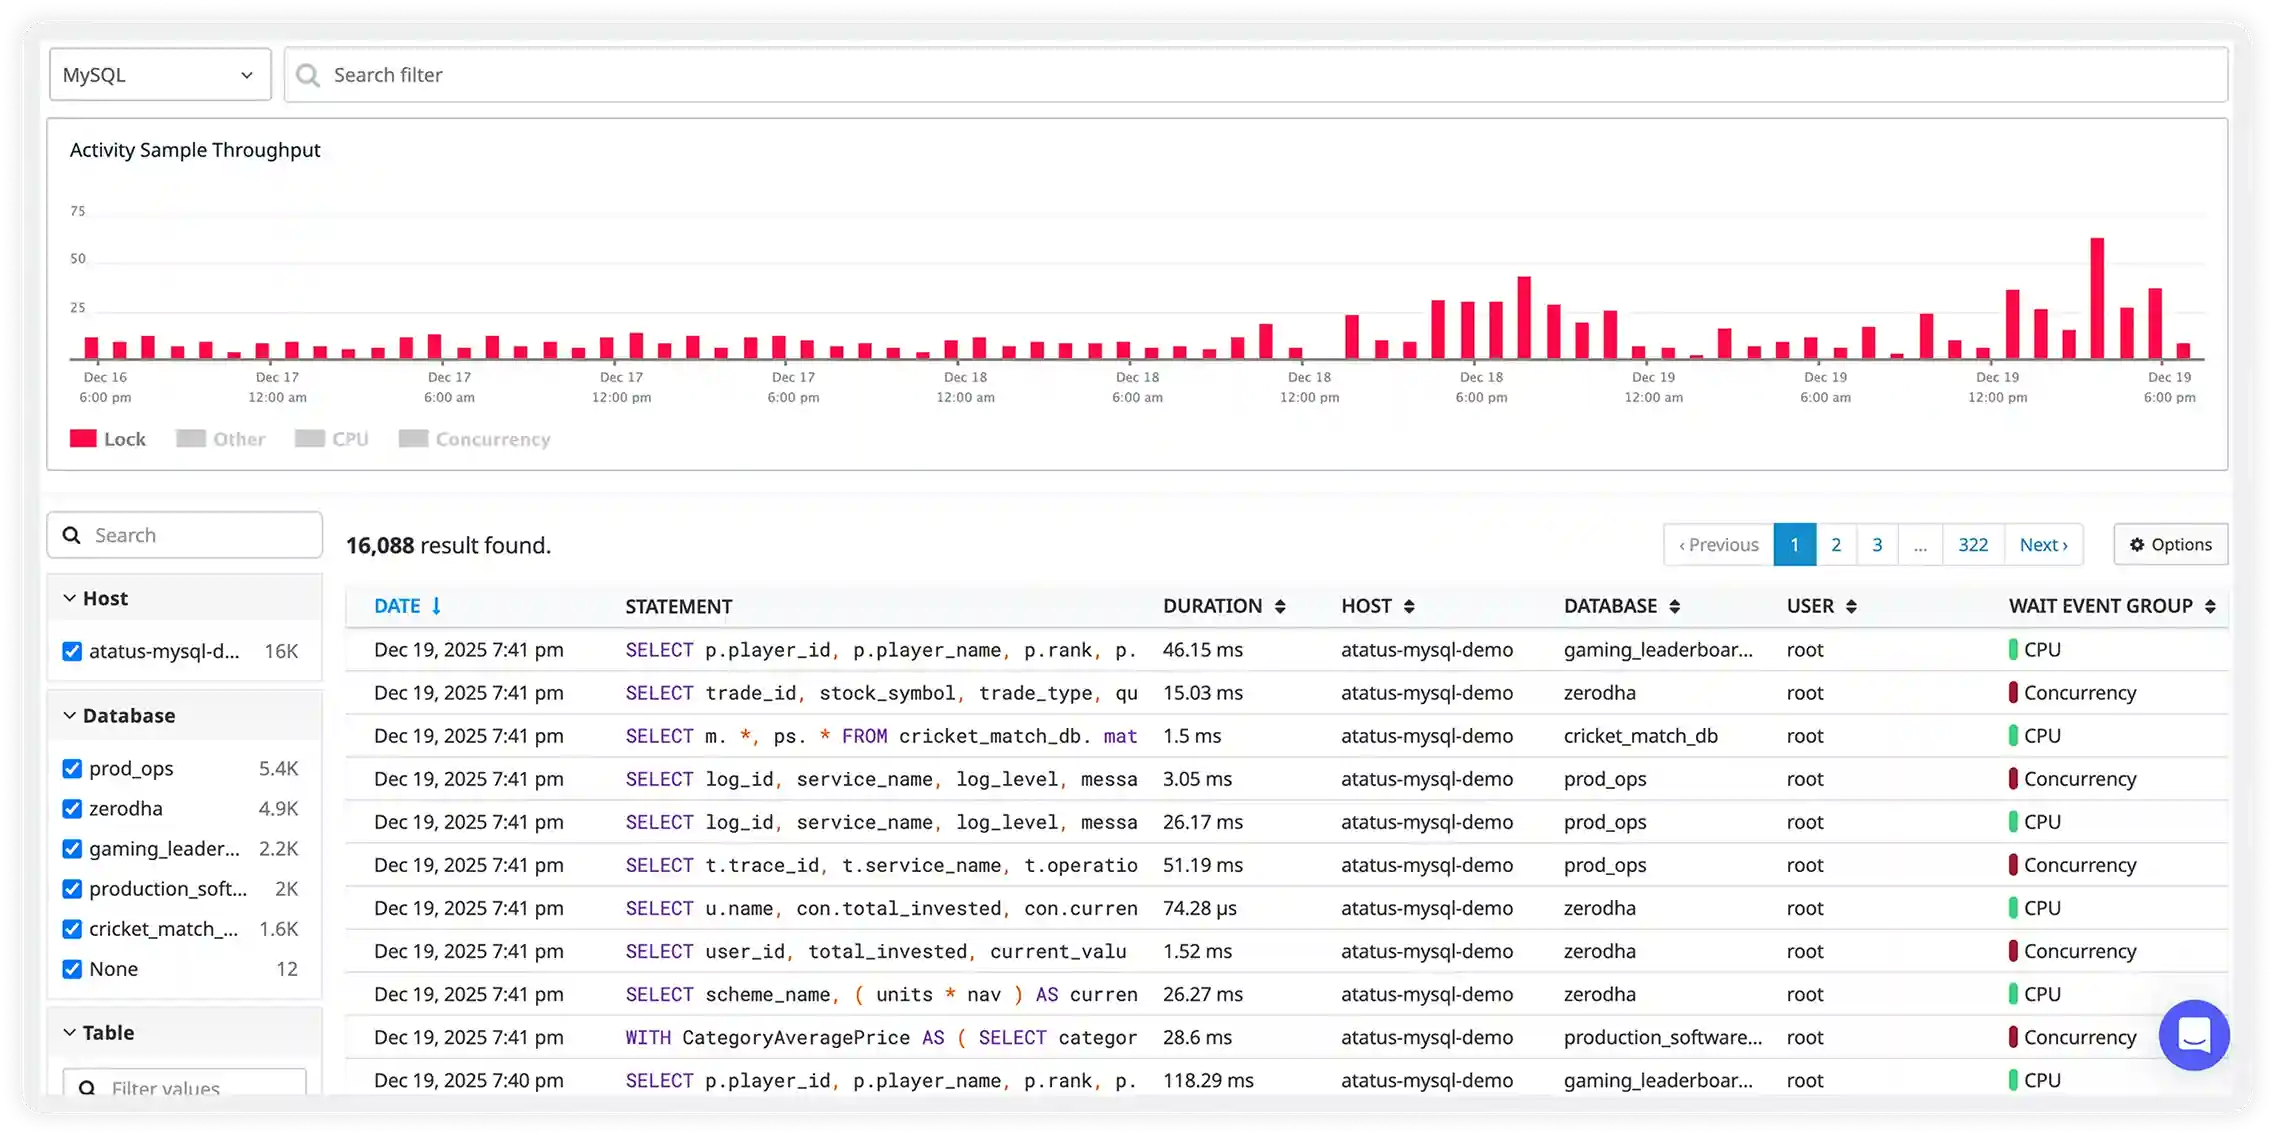
Buffer Cache, I/O Hotspots & Temp Resource Usage
- Track buffer cache hit ratios and memory residency trends to reduce unnecessary physical disk reads and improve query response consistency.
- Identify tables, indexes, and specific workloads generating the highest I/O pressure, enabling focused optimization on storage-intensive operations.
- Monitor TempDB growth driven by sorting, hashing, row versioning, parallel workloads, and intermediate result processing under heavy concurrency.
- Prevent performance degradation caused by disk saturation, memory contention, TempDB bottlenecks, and sustained high-concurrency pressure.
Why choose Atatus for MS SQL database monitoring?
Deep SQL Server visibility
Atatus provides engine-level insights into execution plans, wait stats, and worker threads to optimize performance confidently.
Resolve blocking faster
Atatus detects deadlocks and blocking chains instantly to reduce downtime and transaction delays.
Optimize TempDB usage
Atatus tracks TempDB contention and version store pressure to prevent performance degradation.
Stabilize transaction logs
Atatus monitors log growth, checkpoint behavior, and write pressure to avoid unexpected slowdowns.
Ensure high availability
Atatus tracks availability groups and replication health to maintain uptime and data consistency.
Accelerate root cause analysis
Atatus correlates SQL Server activity with CPU, memory, and disk IO to identify infrastructure bottlenecks quickly.
Unified Observability for Every Engineering Team
Atatus adapts to how engineering teams work across development, operations, and reliability.
Developers
Trace requests, debug errors, and identify performance issues at the code level with clear context.
DevOps
Track deployments, monitor infrastructure impact, and understand how releases affect application stability.
Release Engineer
Measure service health, latency, and error rates to maintain reliability and reduce production risk.