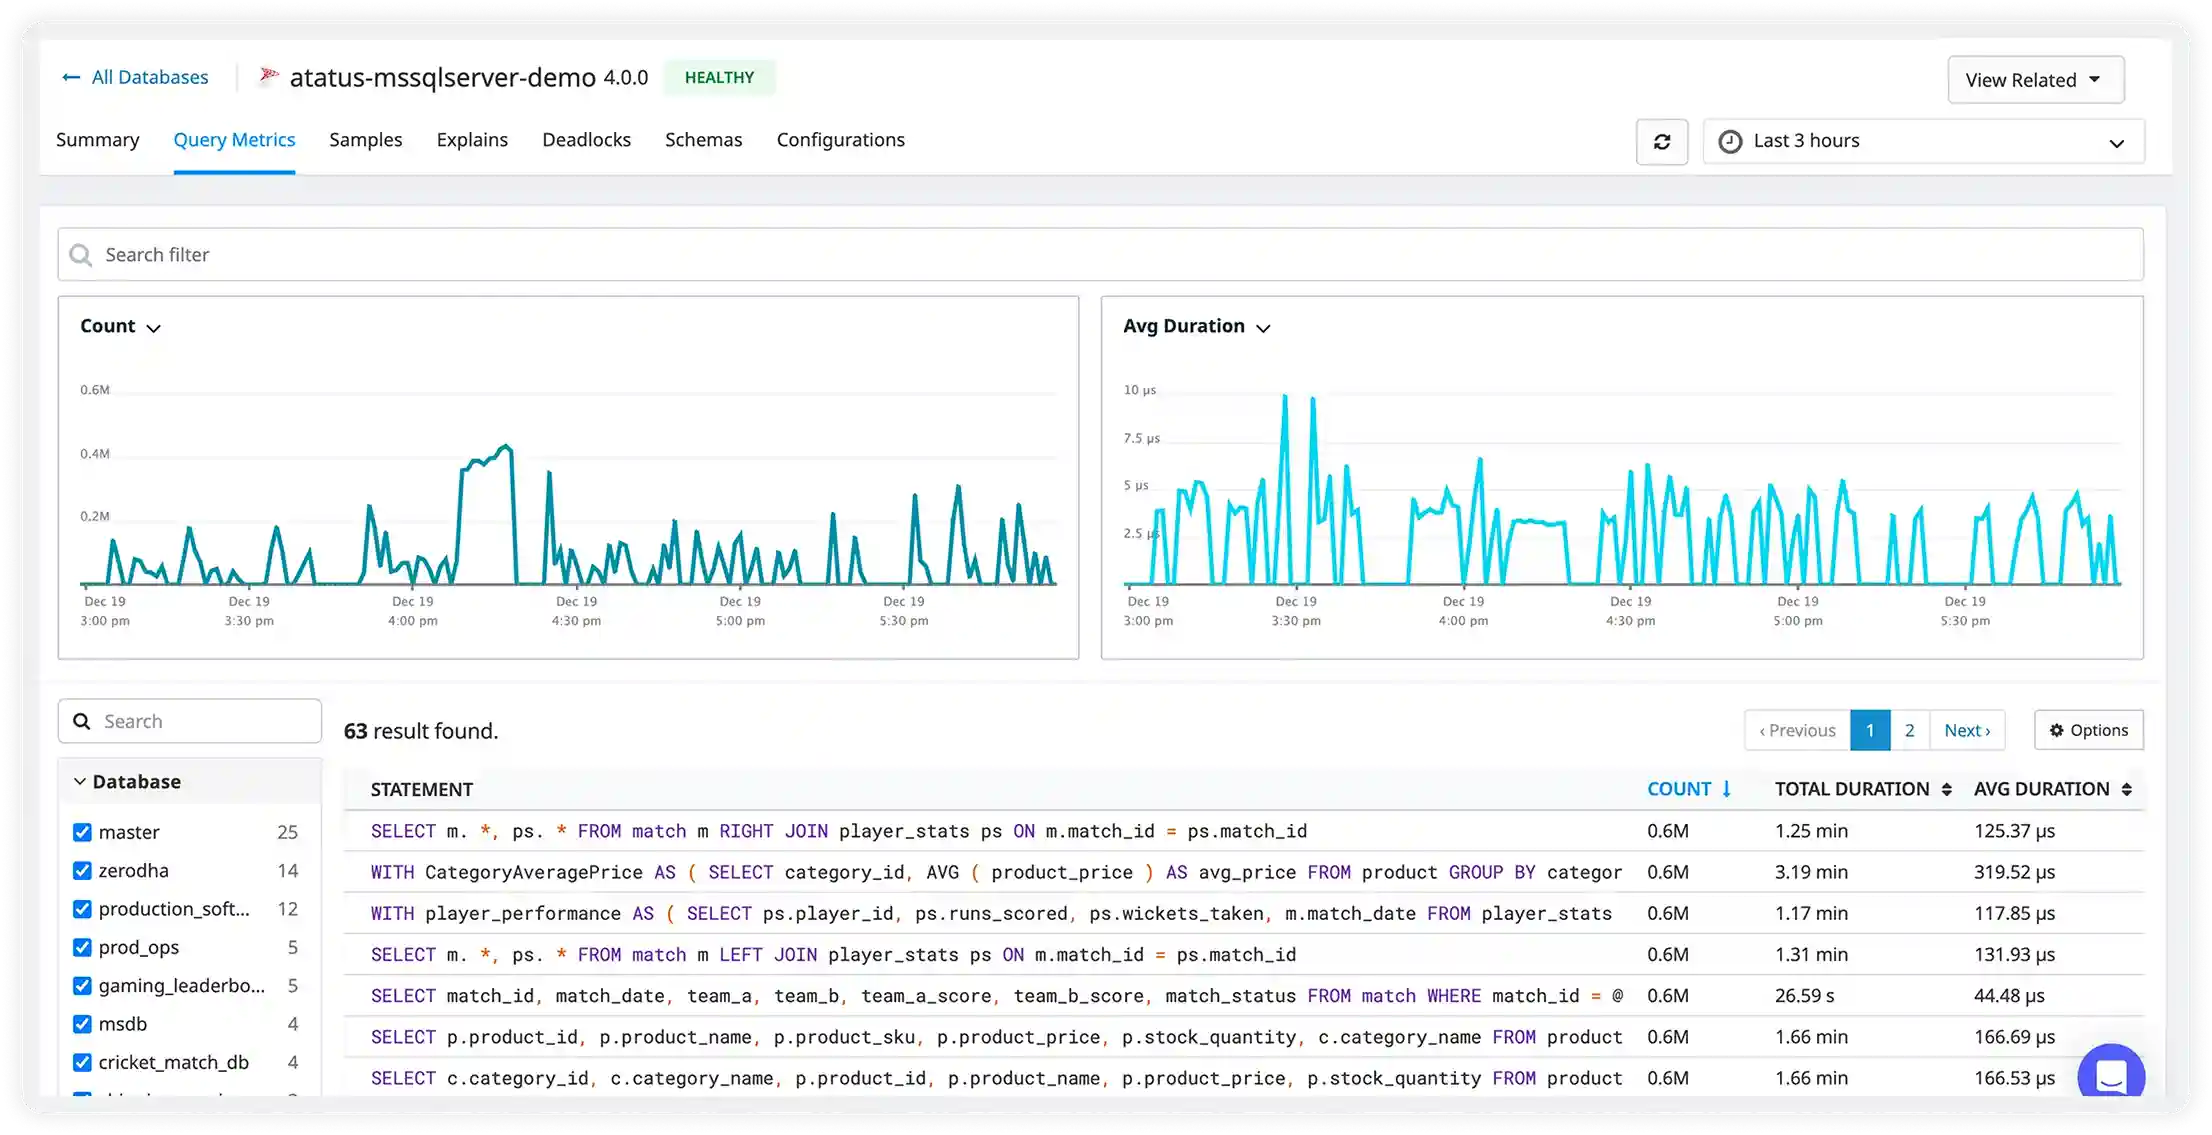
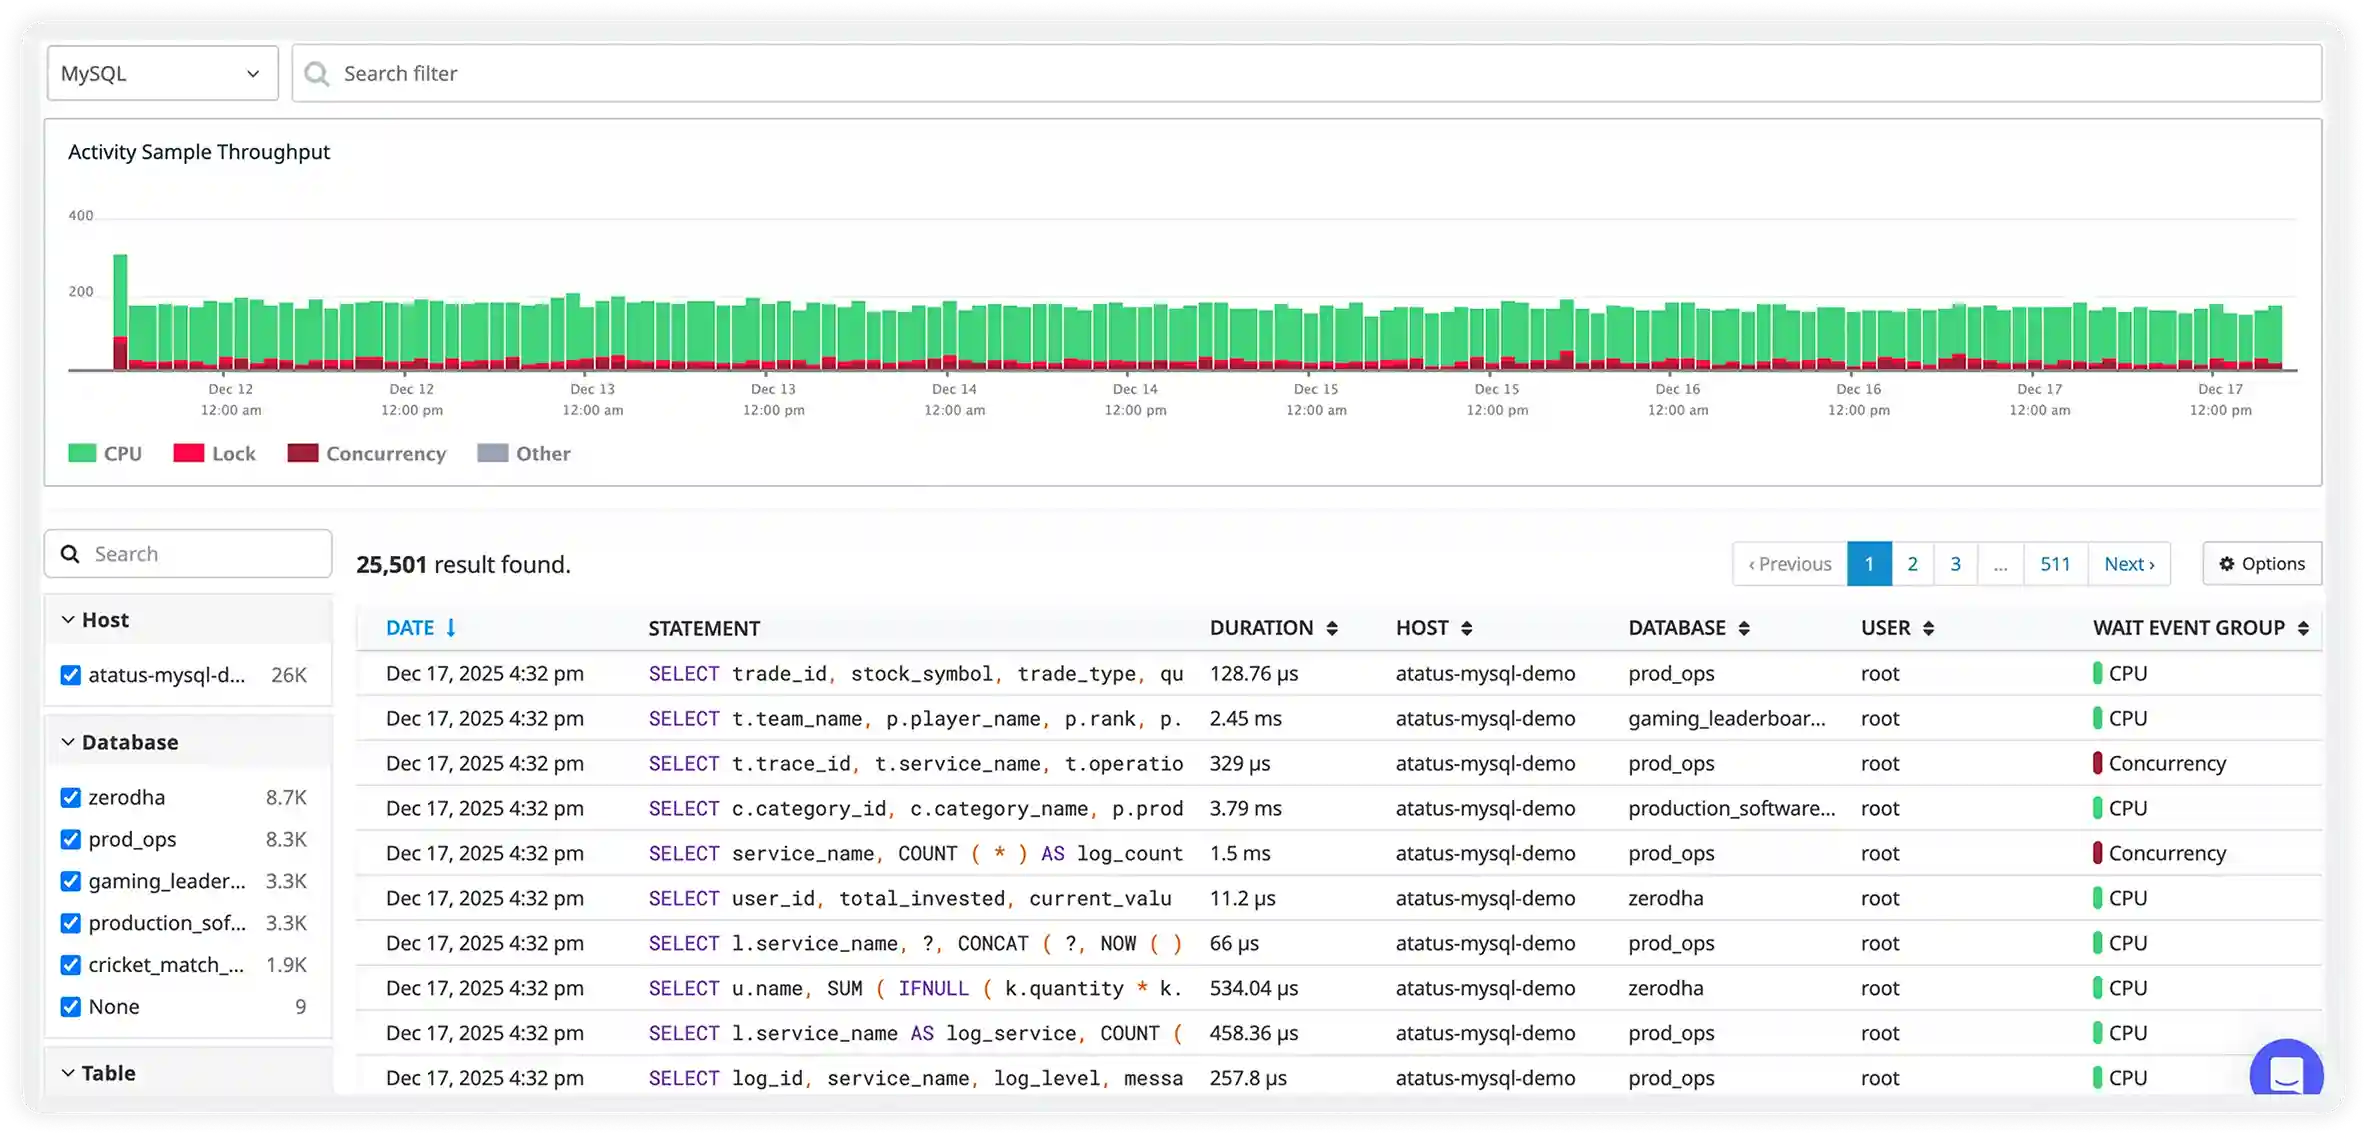
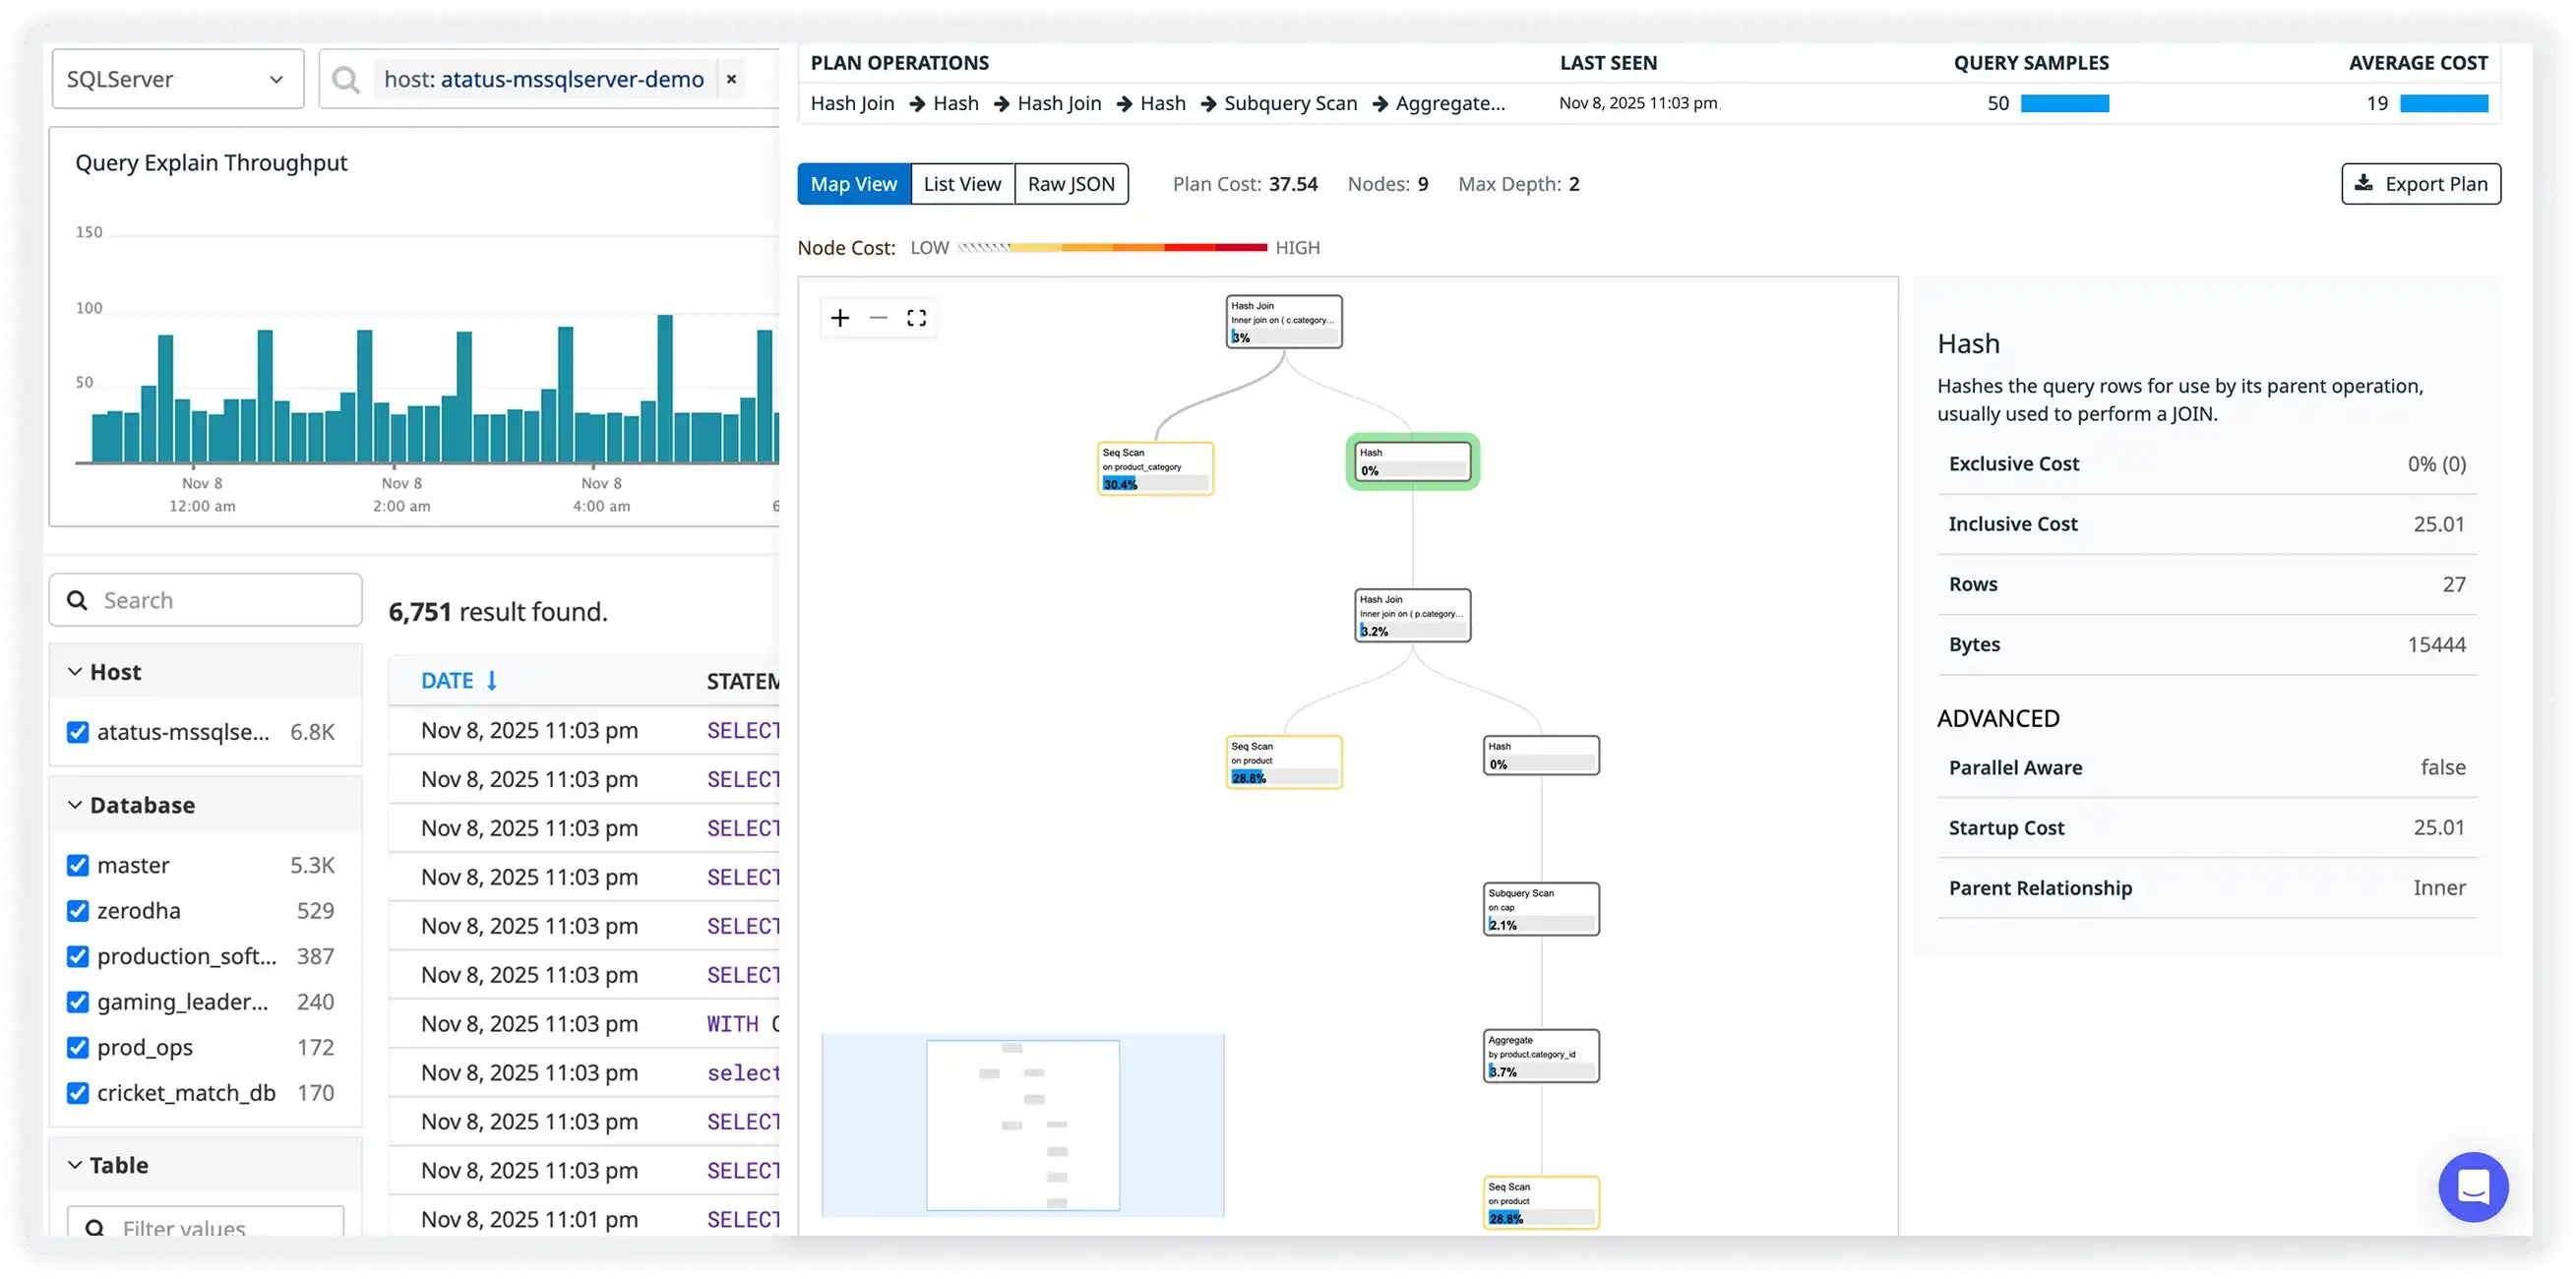
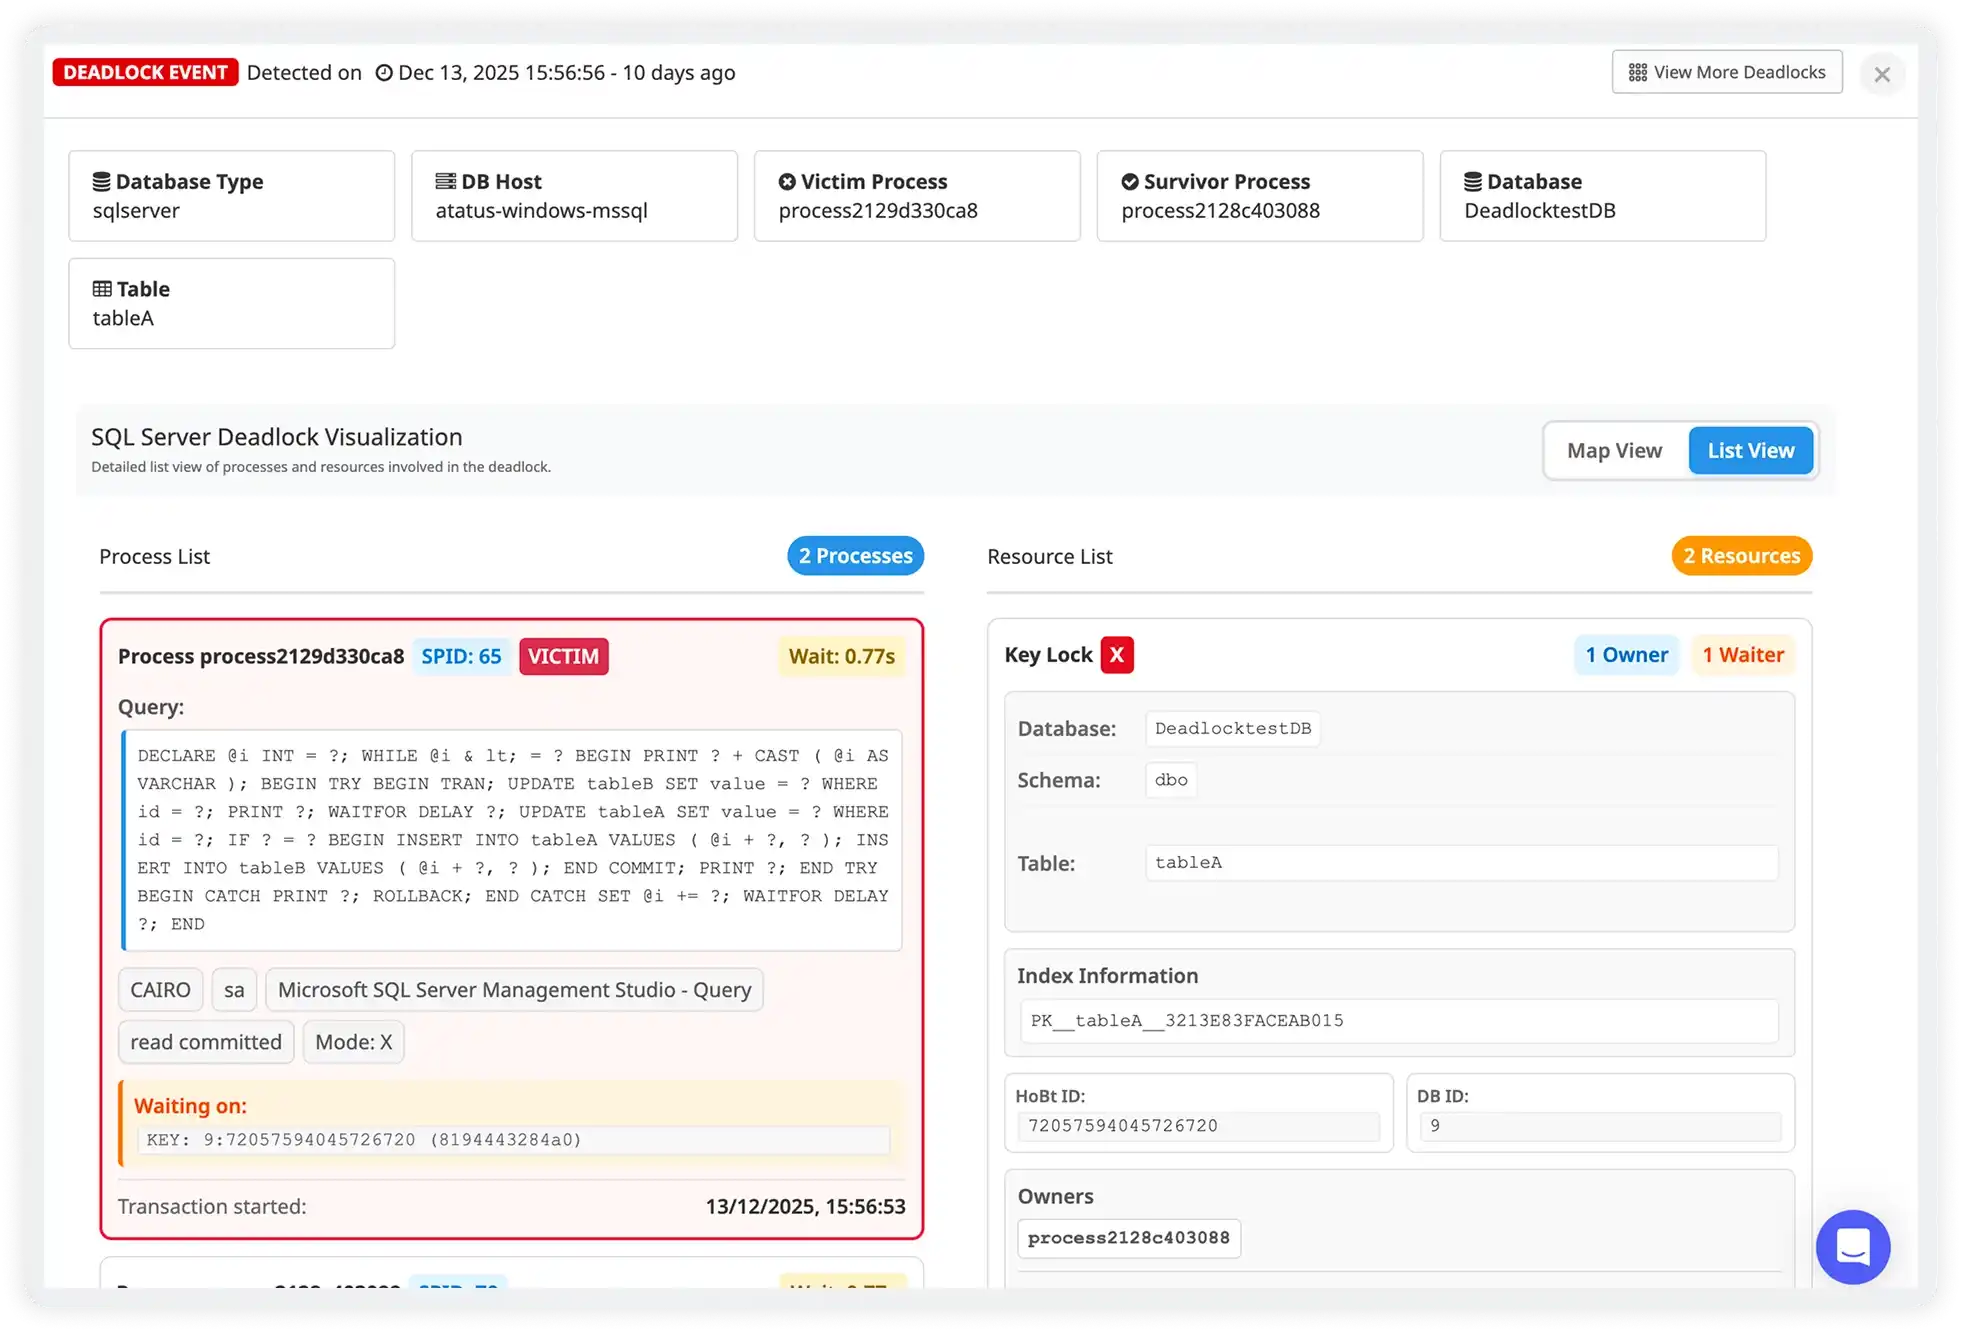
Eliminate Memcached Bottlenecks Before They Impact Your Application Speed
Take control of your Memcached environment, optimize performance, and ensure the reliability of your critical applications
Memcached Database Monitoring
Cache Hit & Miss Analysis
Tracks cache hit ratio, miss rates, and key lookups to identify ineffective caching patterns and unnecessary backend load.
Memory Utilization & Evictions
Monitors memory usage, slab allocation, and eviction rates to detect memory pressure and suboptimal cache sizing.
Item Expiration Behavior
Analyzes item TTLs, expired keys, and premature evictions to understand cache churn and data freshness issues.
Connection & Request Volume
Tracks active connections, request throughput, and command rates to identify traffic spikes and concurrency stress.
Latency & Response Time
Measures get/set operation latency to detect network delays, overloaded nodes, or degraded cache performance.
Slab Fragmentation Analysis
Examines slab class distribution and memory fragmentation to uncover inefficient memory allocation patterns.
Error & Failure Monitoring
Surfaces failed commands, connection errors, and node unavailability events affecting cache reliability.
Node Health & Capacity Trends
Tracks per-node memory, traffic distribution, and uptime metrics to support scaling decisions and capacity planning.
Complete Memcached Performance Visibility
From real-time throughput and memory behavior to cache effectiveness and connection health, everything you need to optimize caching performance at scale.
Cache Throughput & Response Behavior
- Track get, set, delete, and counter operations per second to gain clear visibility into real cache traffic patterns across applications and services.
- Monitor ultra-low latency response times continuously to ensure applications receive fast and consistent cache access under all load conditions.
- Identify sudden traffic spikes or abnormal request bursts that may overload cache nodes, saturate network bandwidth, or degrade performance.
- Compare throughput and response behavior across cache instances to quickly detect uneven load distribution or misconfigured routing.

Memory Utilization & Eviction Trends
- Monitor total memory consumption, slab allocation efficiency, and fragmentation levels in real time to understand how effectively cache memory is being used.
- Track evictions triggered by memory limits, TTL expirations, and aggressive eviction policies that may reduce cache effectiveness.
- Identify oversized cache entries or inefficient object storage patterns consuming excessive memory resources.
- Reduce cache churn and stabilize performance by tuning object size limits, expiration policies, and memory allocation strategies.

Cache Hit Ratio & Effectiveness
- Measure cache hit and miss rates to evaluate how often applications successfully retrieve data without falling back to databases or APIs.
- Identify queries, endpoints, or services that frequently bypass cache layers and generate unnecessary backend load.
- Track hot keys responsible for the majority of successful cache lookups to understand high-value cached data.
- Improve overall application performance by refining caching strategies, TTL rules, and key design.

Connection Load & Request Health
- Monitor active client connections, concurrent request volume, and connection churn rates to maintain stable cache operations.
- Detect overloaded cache nodes early before rising latency impacts application responsiveness.
- Track failed, dropped, or timed-out requests that affect application reliability and user experience.
- Maintain consistent cache performance during traffic surges, seasonal peaks, and high-concurrency workloads.

Why choose Atatus for Memcached monitoring?
Memcached-specific insights
Track cache hit ratios, evictions, slab usage, connections, and command rates to reflect real production behavior.
Cache efficiency clarity
Surface cache misses, poor key access patterns, and high eviction rates to improve caching strategy.
Memory utilization visibility
Monitor slab allocation, fragmentation, and memory pressure to prevent wasted capacity.
Latency performance tracking
Measure get/set latency and throughput to detect overloaded nodes and slow responses.
Full infrastructure correlation
Connect cache activity with CPU, memory, and network metrics to isolate root causes.
Zero-impact monitoring
Collect performance data without adding overhead or affecting high-throughput workloads.
Unified Observability for Every Engineering Team
Atatus adapts to how engineering teams work across development, operations, and reliability.
Developers
Trace requests, debug errors, and identify performance issues at the code level with clear context.
DevOps
Track deployments, monitor infrastructure impact, and understand how releases affect application stability.
Release Engineer
Measure service health, latency, and error rates to maintain reliability and reduce production risk.