Monitor Every Layer of Your
Network
Atatus gives engineering teams complete visibility across every layer of their network. From the physical devices in your data center to the traffic paths crossing your cloud and WAN, when something goes wrong you know exactly where and why.
Every hop
End-to-end path visibility across cloud and WAN
Real-time
SNMP trap ingestion from any network device
500+
Network device profiles supported out of the box
No agents
Agentless monitoring for all network hardware
Built for the hardest network problems
BGP Rerouting and Path Changes
Don't just know a request took 4 seconds — know it was validate_cart.py:142 making 47 redundant database calls. Fix it once, permanently.
Cloud Migration Validation
Track heap allocations over time. See which function is retaining objects it shouldn't. Catch leaks before they crash production with an OOM error.
Hybrid Cloud Connectivity
Automatically surface N+1 query patterns that only appear under real production load. Get the exact call stack, the count, and a suggested fix.
Capacity Planning
Know within minutes of a deploy whether new code introduced a performance regression. Roll back with confidence — backed by data, not instinct.
Hardware Fault Detection
Profile your workers, queues, and cron jobs. Find out why that nightly job takes 4 hours when it should take 20 minutes.
Incident Root Cause Analysis
Identify which services consume the most CPU relative to their workload. Optimize the code, right-size the servers, and reduce your AWS or GCP bill.
Everything your network team needs, in one place
Your network doesn't stop at the cloud boundary
Traffic flows across cloud VPCs, WAN links, colocation facilities, and on-premises data centers. Problems surface at the transitions between them and at the ones you are watching least carefully. Atatus gives you one view across all of it so your team stops switching between tools and starts finding root causes.
- Monitor connectivity between any two endpoints at the service, pod, cluster, or host level across cloud and on-premises
- Track multi-cloud network performance across AWS, Azure, and GCP alongside your physical infrastructure in one view
- Verify connectivity to third-party services and internet endpoints to rule out external factors during an incident
- Containers, VMs, serverless workloads, and physical devices all visible from the same platform
Stop guessing. Start fixing with precise network data
When your application is slow the question is never "is it the network?" It is "which part of the network, and exactly how much?" Atatus gives you per-hop latency, device health metrics, and interface-level throughput data so your team can answer that in minutes, not hours.
- Isolate whether slowdowns originate in cloud routing, WAN peering, or on-premises hardware
- Correlate application performance degradation with network path changes automatically
- Replay historical path topology from the exact moment an incident began
- Reduce MTTR by eliminating back-and-forth between network and application teams
Know about problems before your users do
Atatus continuously baselines your network and fires alerts the moment metrics deviate. Whether a WAN link is approaching saturation, a device reports an anomalous CPU spike, or an SNMP trap announces a BGP session drop, every alert carries full network context so your on-call engineer knows exactly what is wrong the moment they are paged.
- Create alert policies on any metric using threshold-based or anomaly detection modes
- Identify unusual traffic patterns including DNS anomalies and unexpected geographies before they escalate
- Pinpoint the top bandwidth consumers by IP, protocol, and application via NetFlow analysis
- Route alerts to PagerDuty, Slack, OpsGenie, or any webhook with full device context included
Network, infrastructure, and applications in one place
Network issues rarely exist in isolation. A saturated WAN link causes application latency. A restarted switch takes down a service. With Atatus, network monitoring sits alongside infrastructure metrics, APM, and log management so your team can trace a problem from the network layer all the way to the user-facing error without switching tools
- Correlate network path anomalies with application performance metrics automatically
- Link device SNMP traps to infrastructure events and service degradations in one timeline
- One platform for cloud, containers, VMs, and physical network hardware
- Shared dashboards, alerts, and on-call workflows across your entire engineering team
Two capabilities. One complete picture
Network monitoring covers two fundamentally different problems. Atatus solves both — and ties them together so your team never loses context switching between them.
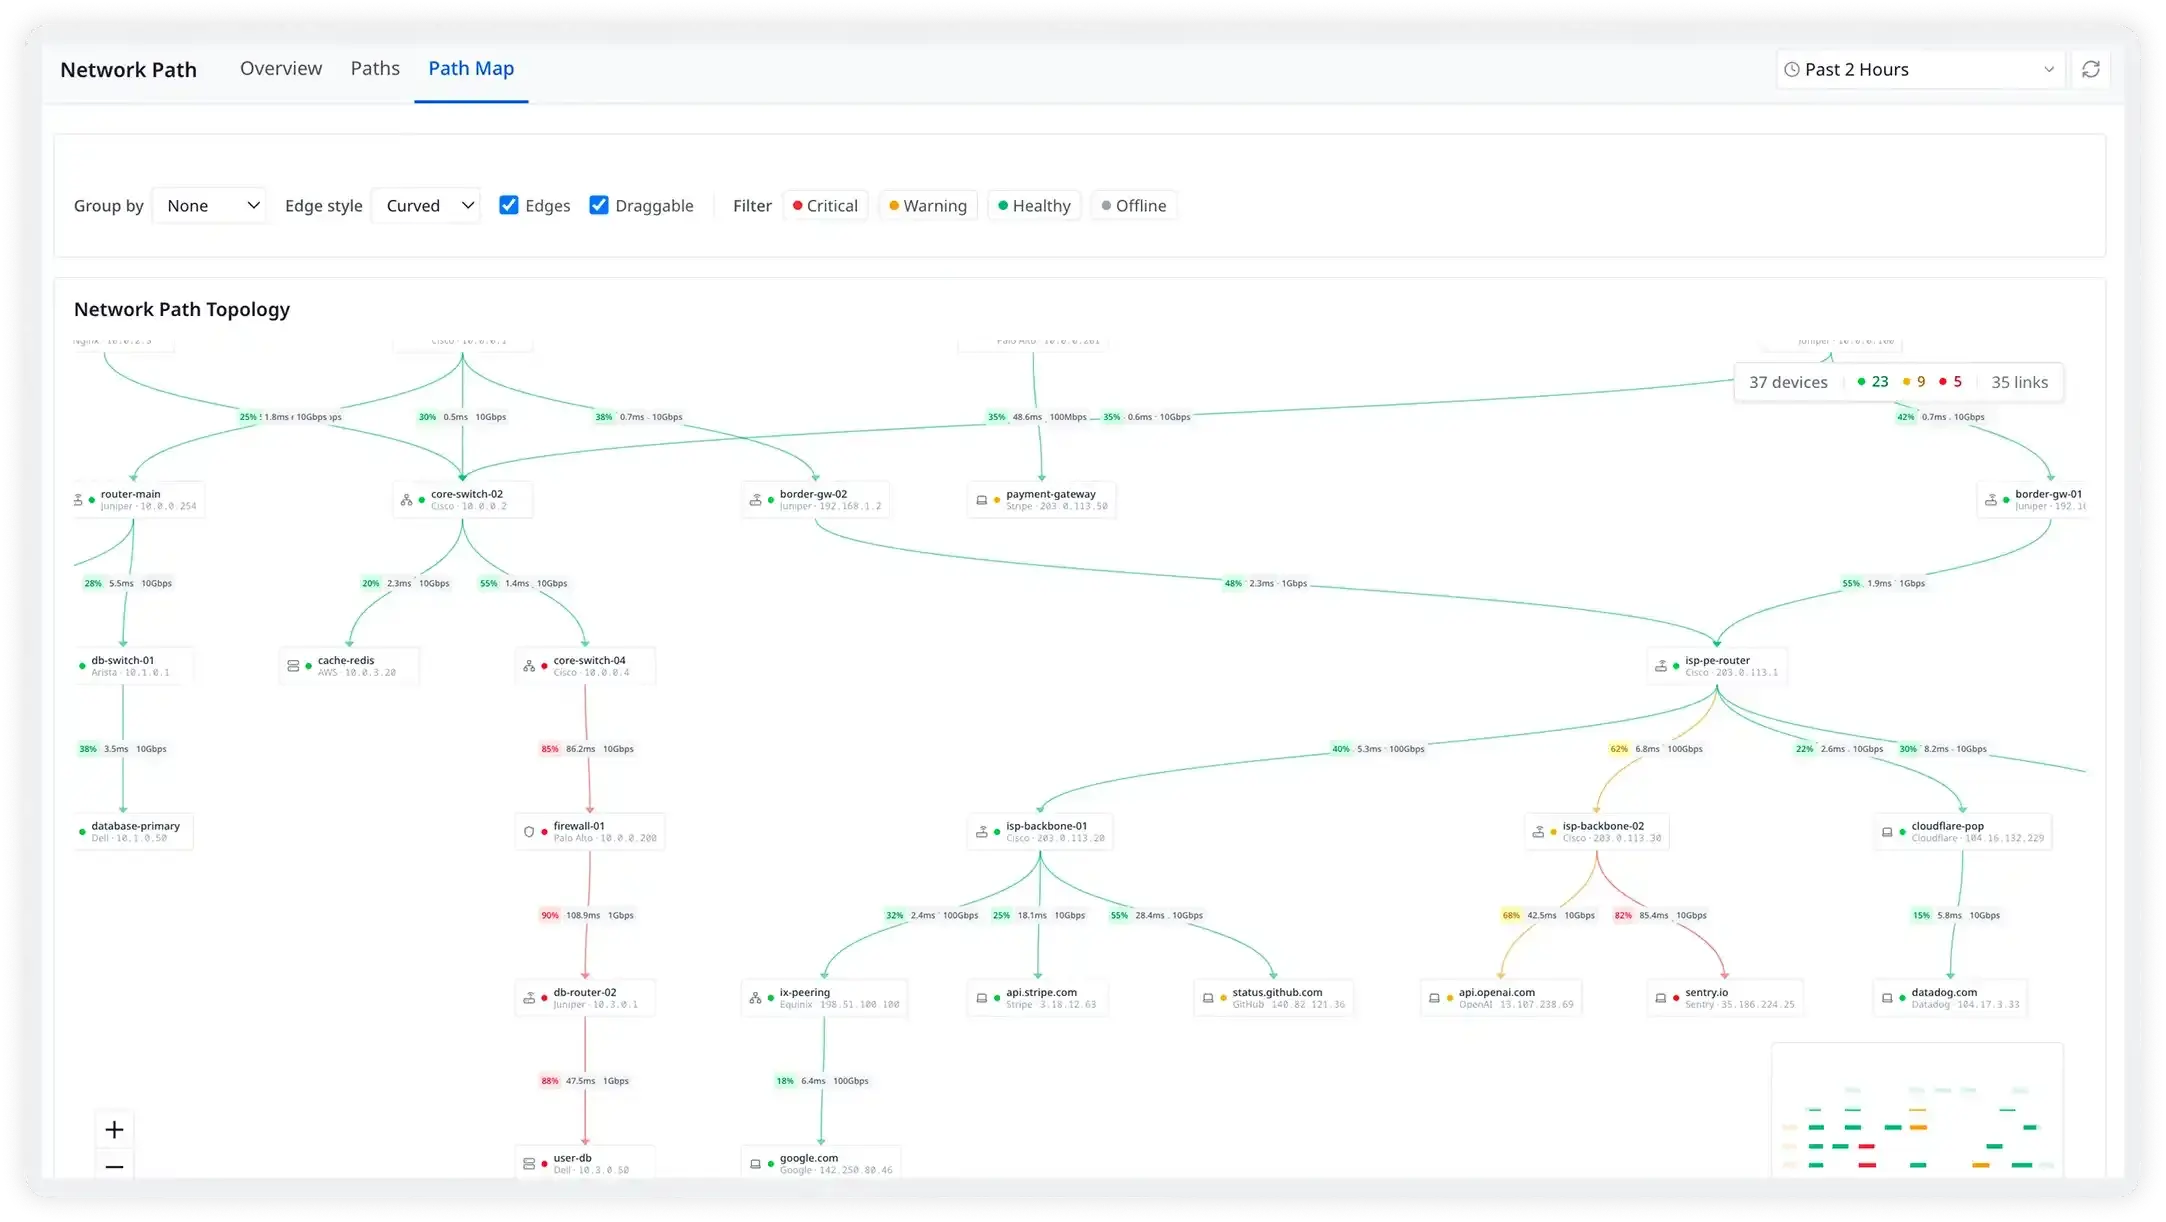
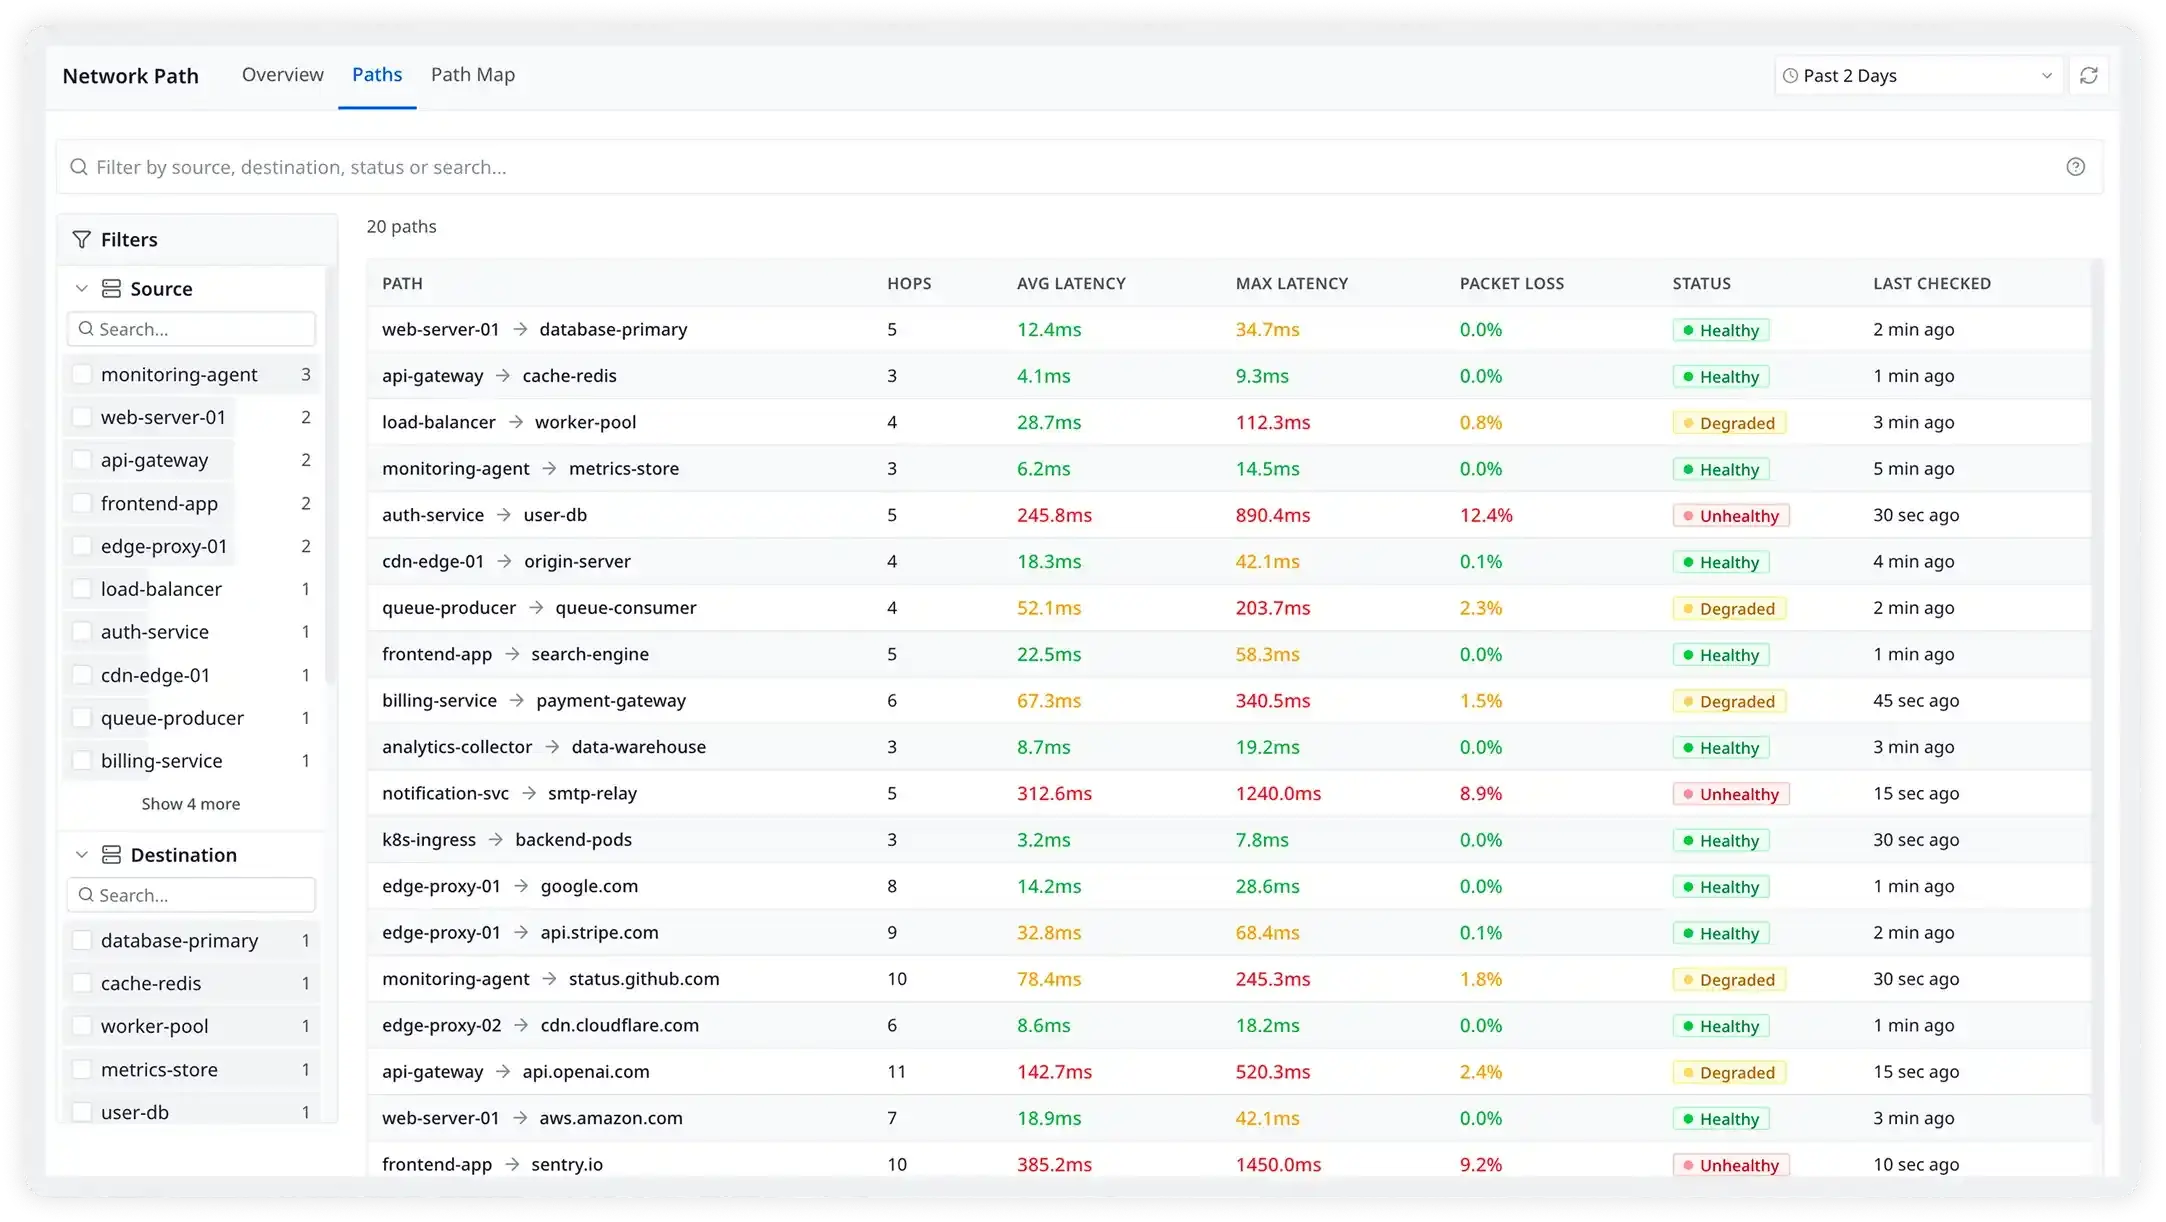
See every hop between every service.
Track the exact route traffic takes between your application endpoints, across cloud VPCs, WAN links, and on-premises fabric with per-hop latency and packet-loss measurements updated continuously.
- •Per-hop latency and loss from every source to every destination
- •Automatic topology change detection when paths shift
- •Historical path replay — rewind to any incident timestamp
- •Supports cloud-to-cloud, cloud-to-on-prem, and WAN paths
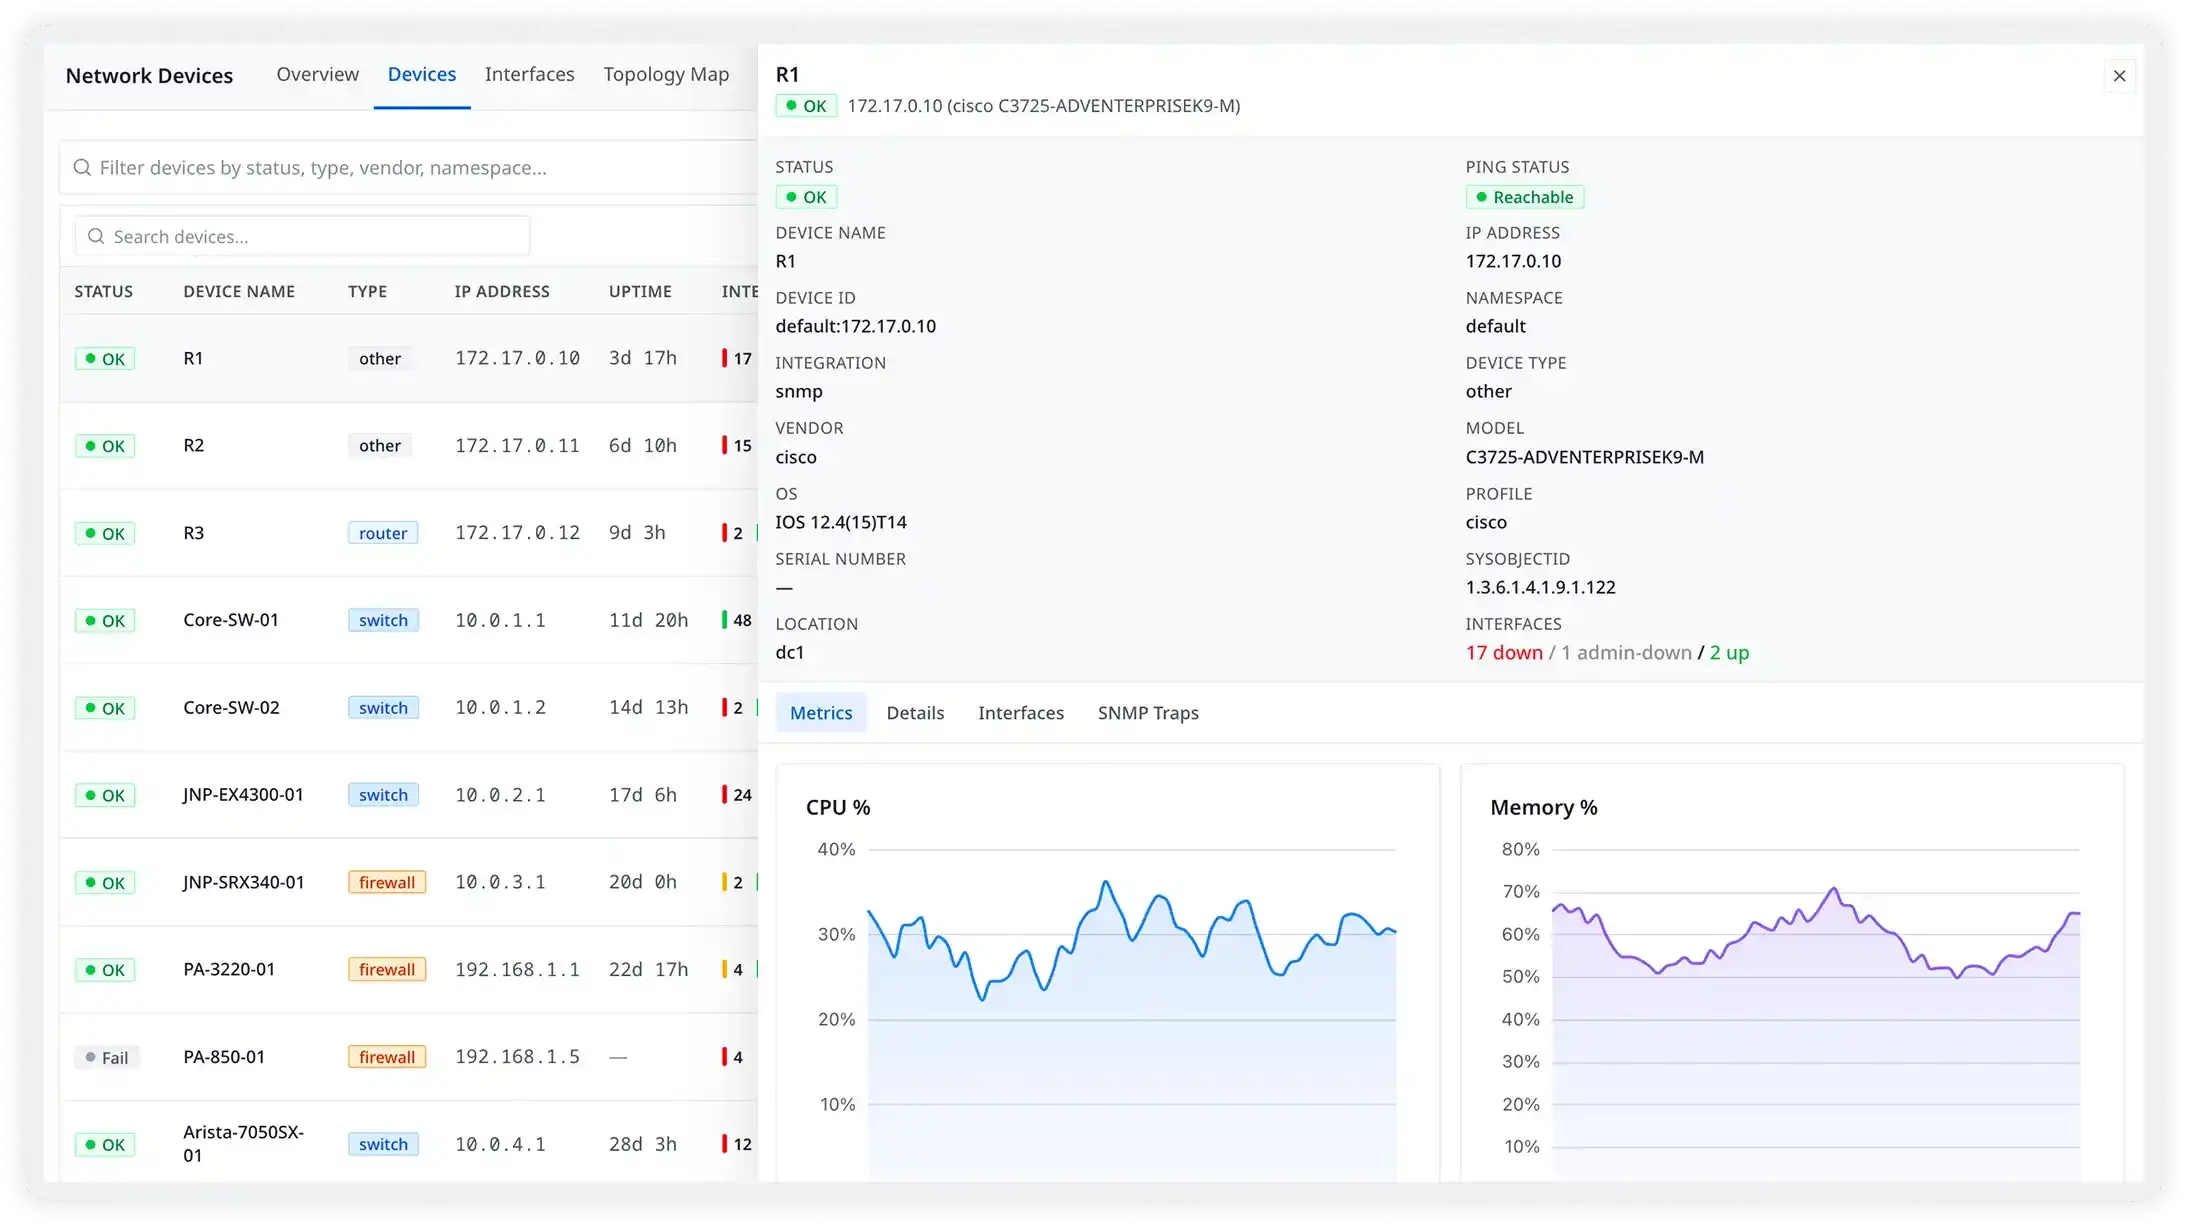
Know the health of every router, switch, and firewall.
Poll your physical and virtual network hardware via SNMP, collect interface throughput and error rates, receive traps the instant a device event fires, and view auto-discovered topology.
- •Agentless SNMP polling — SNMPv2c and SNMPv3
- •500+ pre-built device profiles
- •Real-time SNMP trap ingestion
- •NetFlow / sFlow traffic analysis