Detect Threats 10x Faster with Full Observability Context
Atatus Threat Observability is the intelligence layer inside Atatus SIEM, correlating logs, metrics, and traces in real time so your DevOps, SRE, and Security teams can detect, investigate, and respond to threats with complete context.
10x
Faster mean time to detect
98%
Alert noise eliminated
3 min
Avg. threat triage time
24/7
Continuous threat visibility
Your SIEM has the data. But not the context.
Without unified telemetry, security events are just noise. Threat Observability turns your SIEM data into a complete, and actionable picture.
Alert fatigue burning out your team SIEM generates 500–1,000+ alerts daily. Without observability context to rank them, every alert feels equally urgent and real threats get missed.
Logs alone don't tell the full story A log event shows what happened. A correlated trace shows how an attacker got there. A metric shows the blast radius. You need all three in one place.
Investigations start from scratch every time Manual pivoting between APM, log search, infra dashboards, and security tools adds hours per incident. Atatus SIEM with Threat Observability eliminates the pivot.
Kubernetes and container activity is invisible Ephemeral workloads don't leave traces in traditional log pipelines. Without runtime observability, attackers exploit the gaps between your pods and your SIEM.
Built for every security workflow in Atatus
Threat Observability powers the security capabilities across Atatus's product suite, linked directly to the products your team already uses.
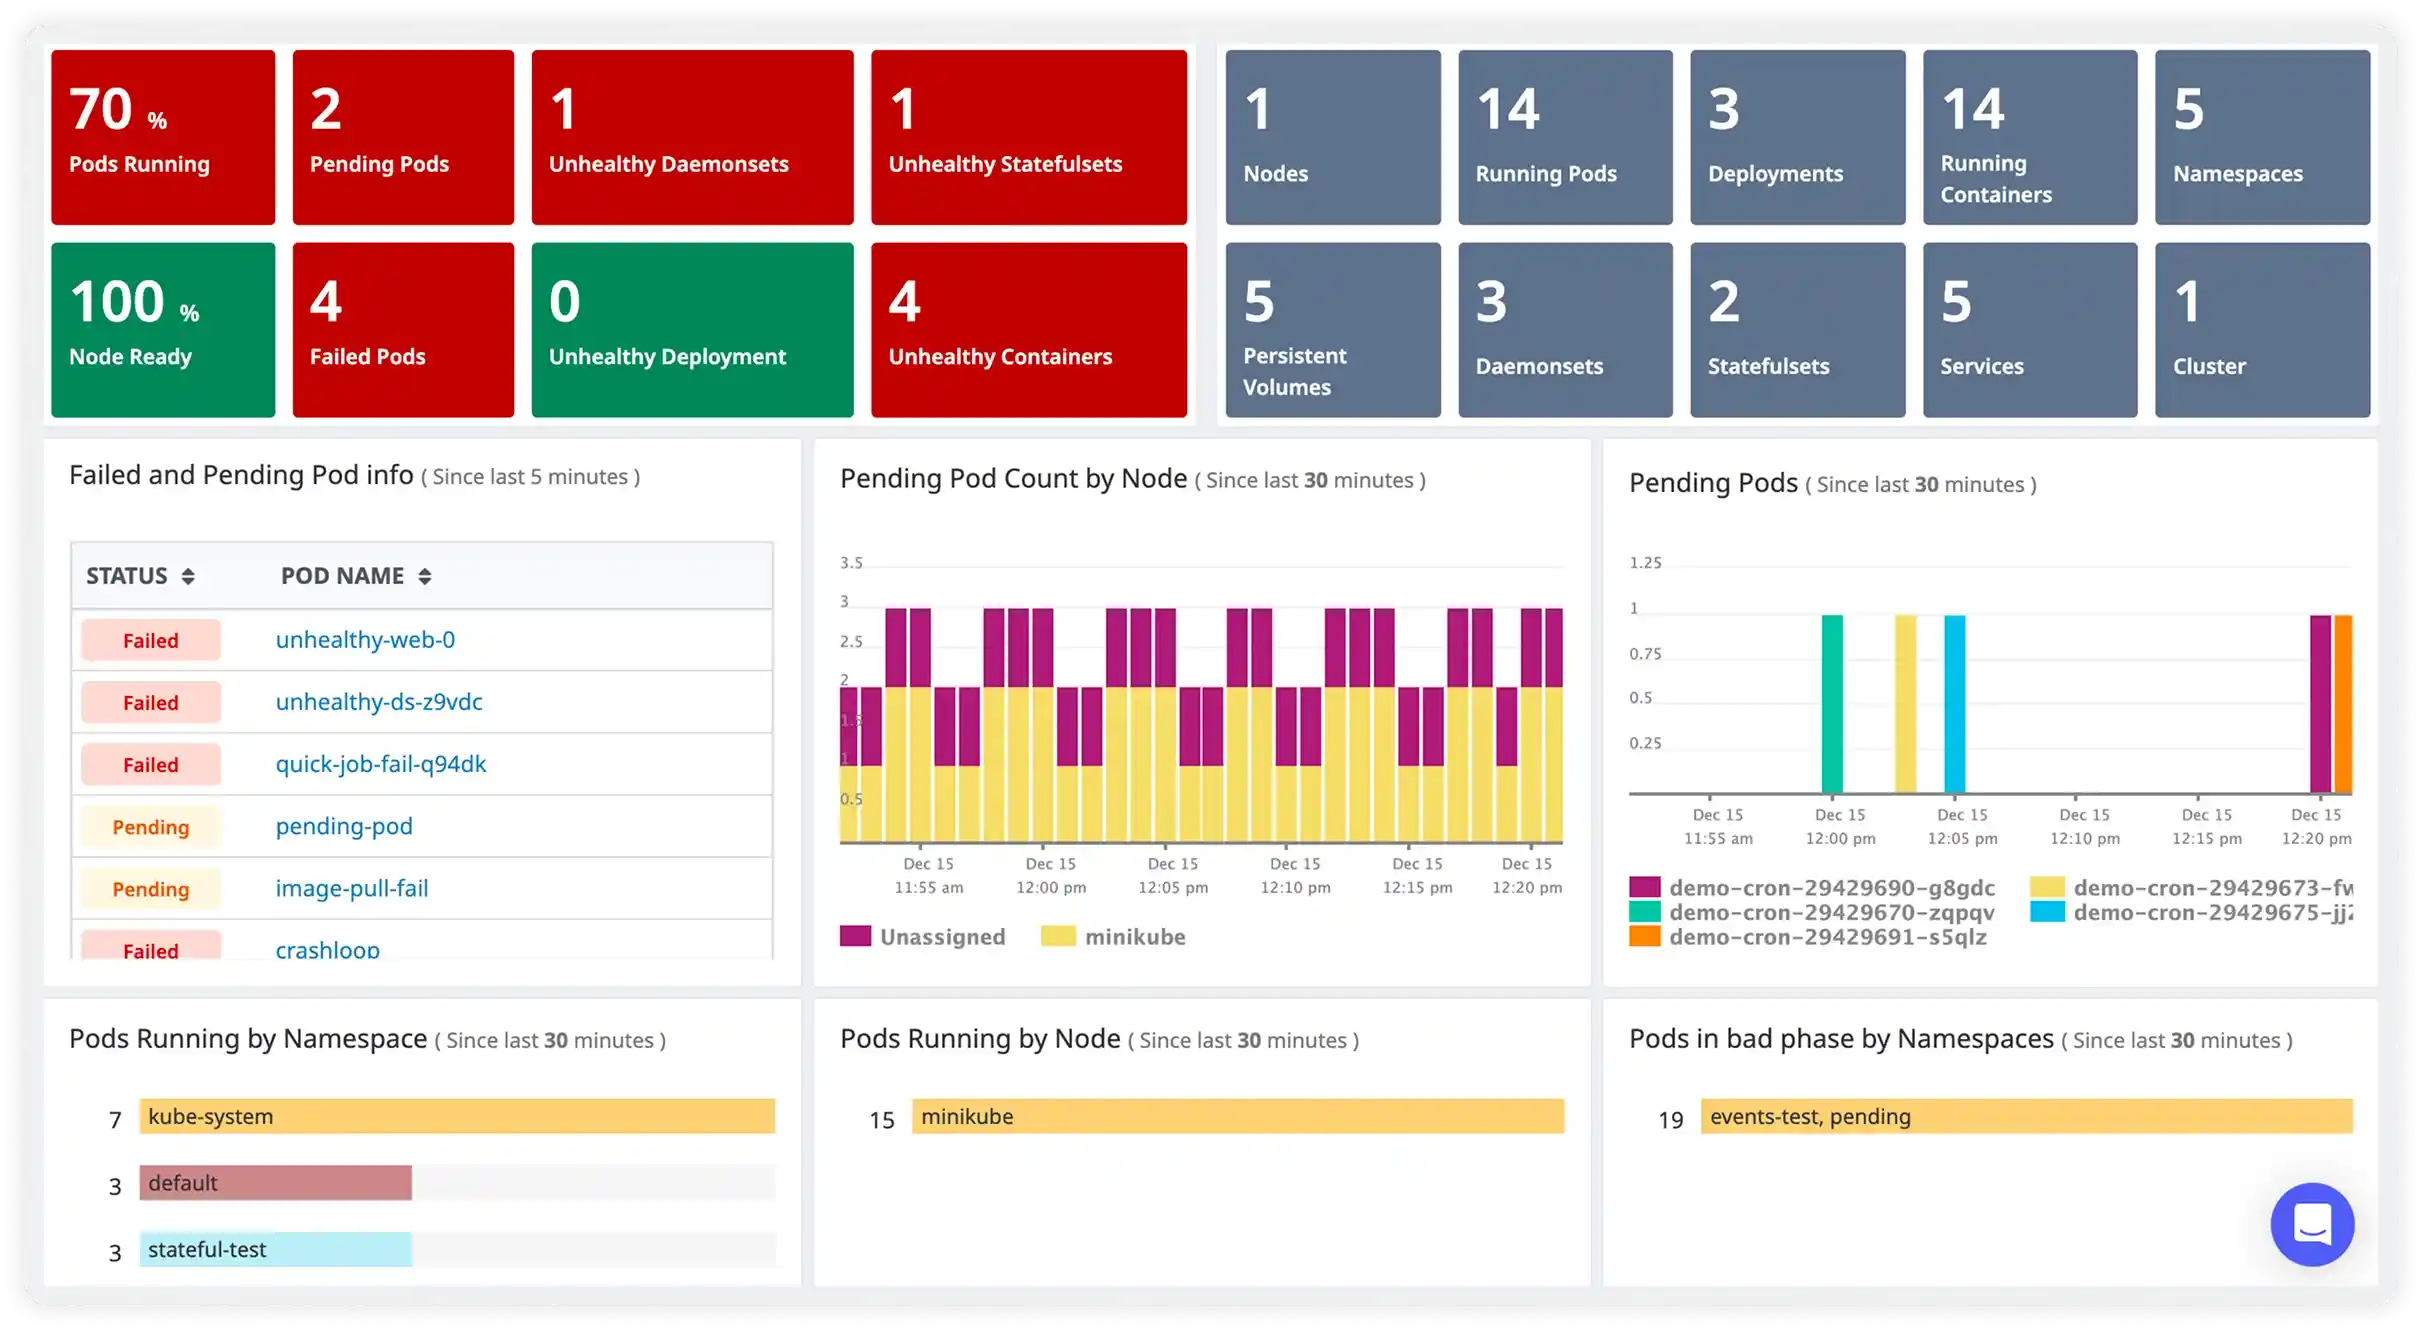
Kubernetes Runtime Security
Kubernetes clusters are high-value attack targets. Container breakouts, supply chain attacks, and misconfigured RBAC are invisible to log-only SIEMs. Atatus understands pod lifecycle, service mesh traffic, and control plane events natively, so Threat Observability detects what others miss.
- Detect runtime anomalies such as unexpected process executions, network connections, and file writes inside containers
- Monitor Kubernetes audit logs inside Atatus SIEM for RBAC abuse and API server anomalies
- Correlate container network flows with trace spans to identify C2 communication patterns
- Enforce continuous security posture, not just at deploy time
DevSecOps Continuous Security
Atatus bridges Dev, SRE, and Security with shared observability data. Threat Observability adds a security intelligence layer on top of your existing APM and log pipeline, so vulnerabilities found in production have full trace context, not just a CVE number.
- Surface runtime vulnerability exploitability from Atatus Application Security Management, not just CVSS scores
- Detect suspicious behavior introduced by new deployments within minutes using APM traces as context
- Shared SIEM dashboards for Dev, SRE, and Security, one source of truth
- Auto-generate response tickets and runbooks on threat detection via Atatus Alerting + Watchtower
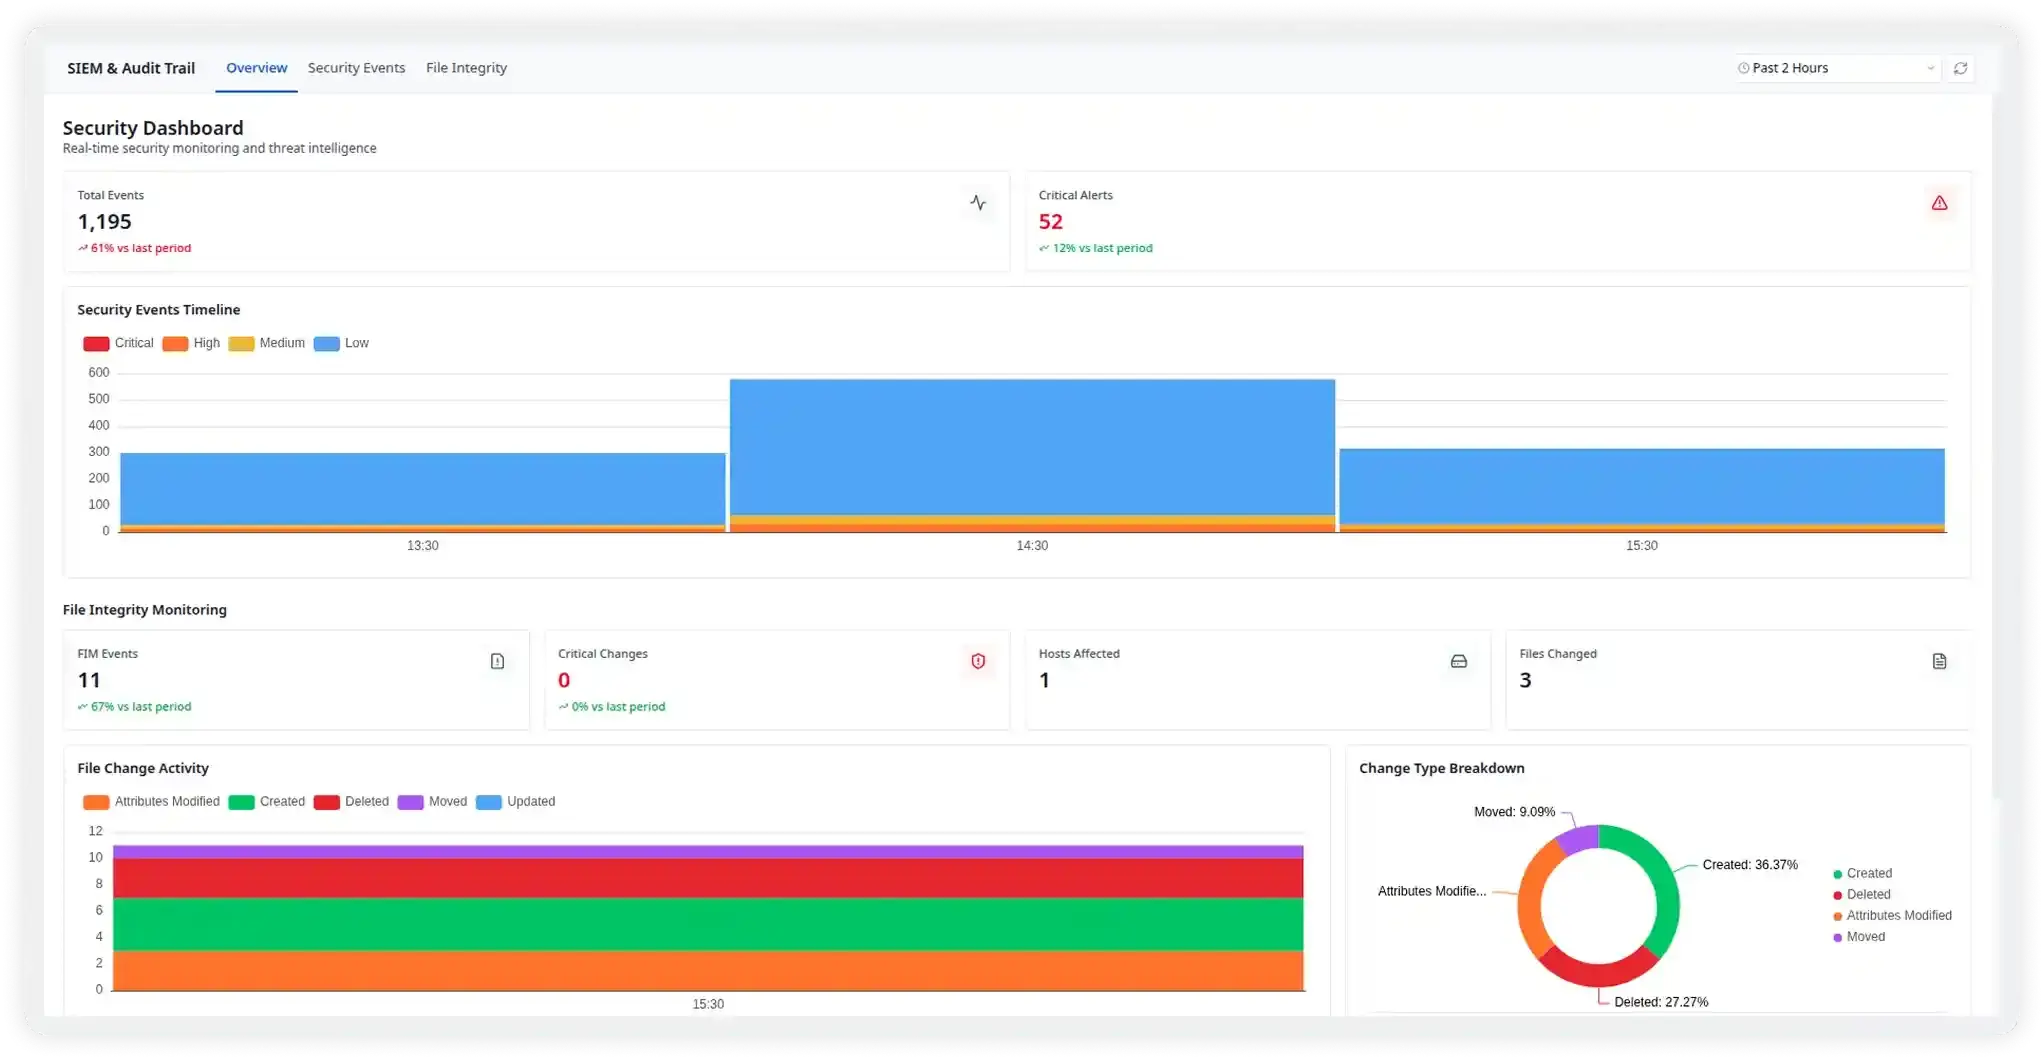
Incident Forensics & Investigation
Atatus Log Management retains years of logs, metrics, and traces with full observability context. Threat Observability extends this into a forensic investigation platform, letting you reconstruct exactly what happened, when, and through which service path.
- Query logs, metrics, events, and traces simultaneously with Atatus's unified search
- Timeline view that reconstructs full kill chains from first recon to exfiltration using distributed traces
- Identify indicators of compromise (IoCs) hidden in trace spans that log-only tools miss
- Export evidence packages for compliance, legal, and regulatory reporting
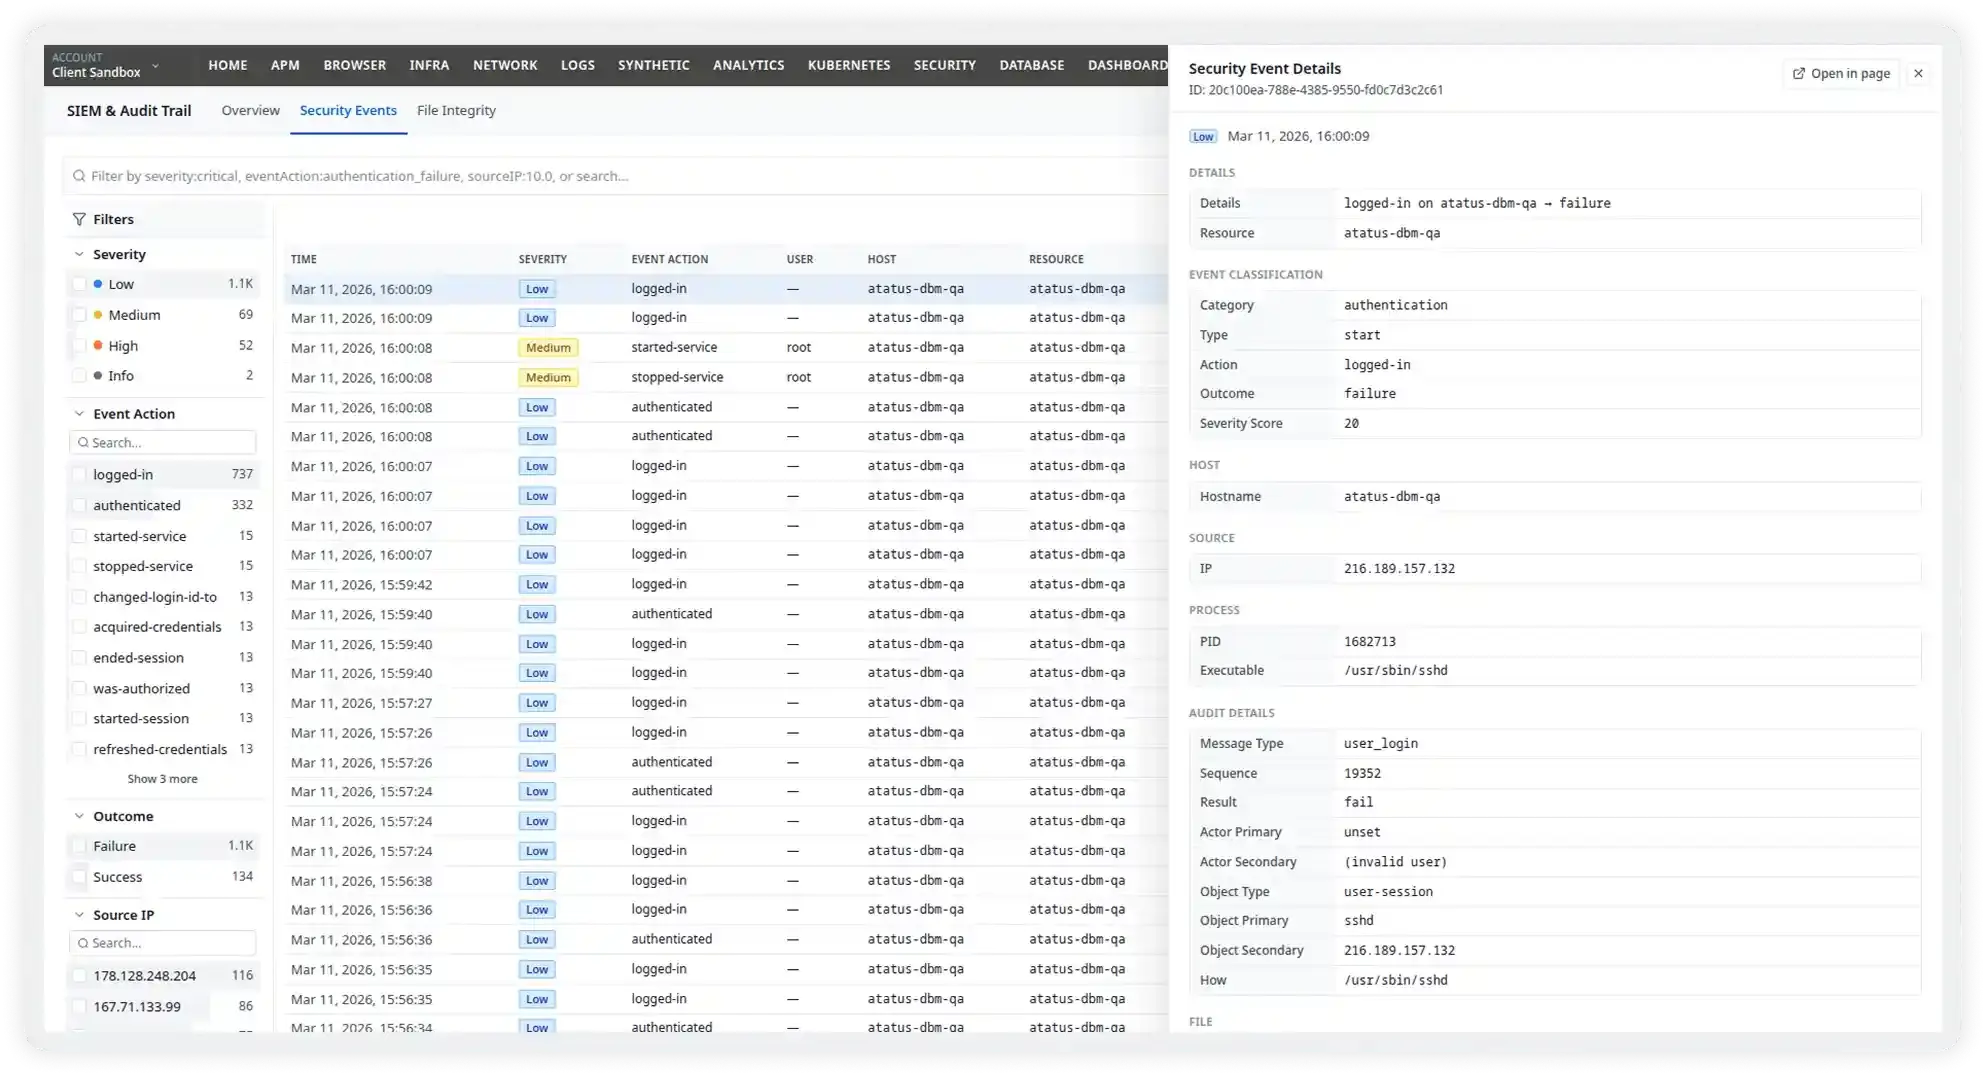
Cloud Security Event Management
Modern cloud environments generate hundreds of thousands of security events daily. Atatus SIEM ingests events from AWS, Azure, and GCP, then Threat Observability enriches them with service topology and exposure context to reduce the signal from 400K events to a handful of real alerts.
- Ingest AWS CloudTrail, GCP Audit Logs, and Azure Monitor events directly into Atatus SIEM
- Enrich cloud alerts with real-time service topology and exposure scores from Atatus Infra Monitoring
- Automatically categorize events by MITRE ATT&CK tactic and surface only actionable threats
- Visualize blast radius and affected services for any cloud security event
What Threat Observability unlocks inside Atatus SIEM
Runtime Threat Detection
Continuously analyze runtime behavior across your entire stack such as apps, containers, microservices, APIs, and serverless functions. Atatus correlates SIEM log events with live trace spans and metric anomalies, detecting zero-days, privilege escalations, and injection attacks in real time.
Alert Noise Reduction
Atatus SIEM ingests thousands of raw events. Threat Observability enriches each event with observability context like service exposure, active sessions, request traces to rank only what truly matters.
Automated Threat Correlation
AI automatically links related log events, trace spans, and metric spikes into a single incident timeline, no manual pivoting required. What used to take 45 minutes now takes under 3.
Attack Path Analysis
Visualize exactly how an attacker moved from initial access to lateral movement to target. Distributed traces capture recon activity that logs alone would miss entirely.
Faster Incident Response
Reusable response playbooks, automated workflows, and one-click runbooks built on Atatus's existing alerting and Watchtower capabilities. Consistent, fast response.
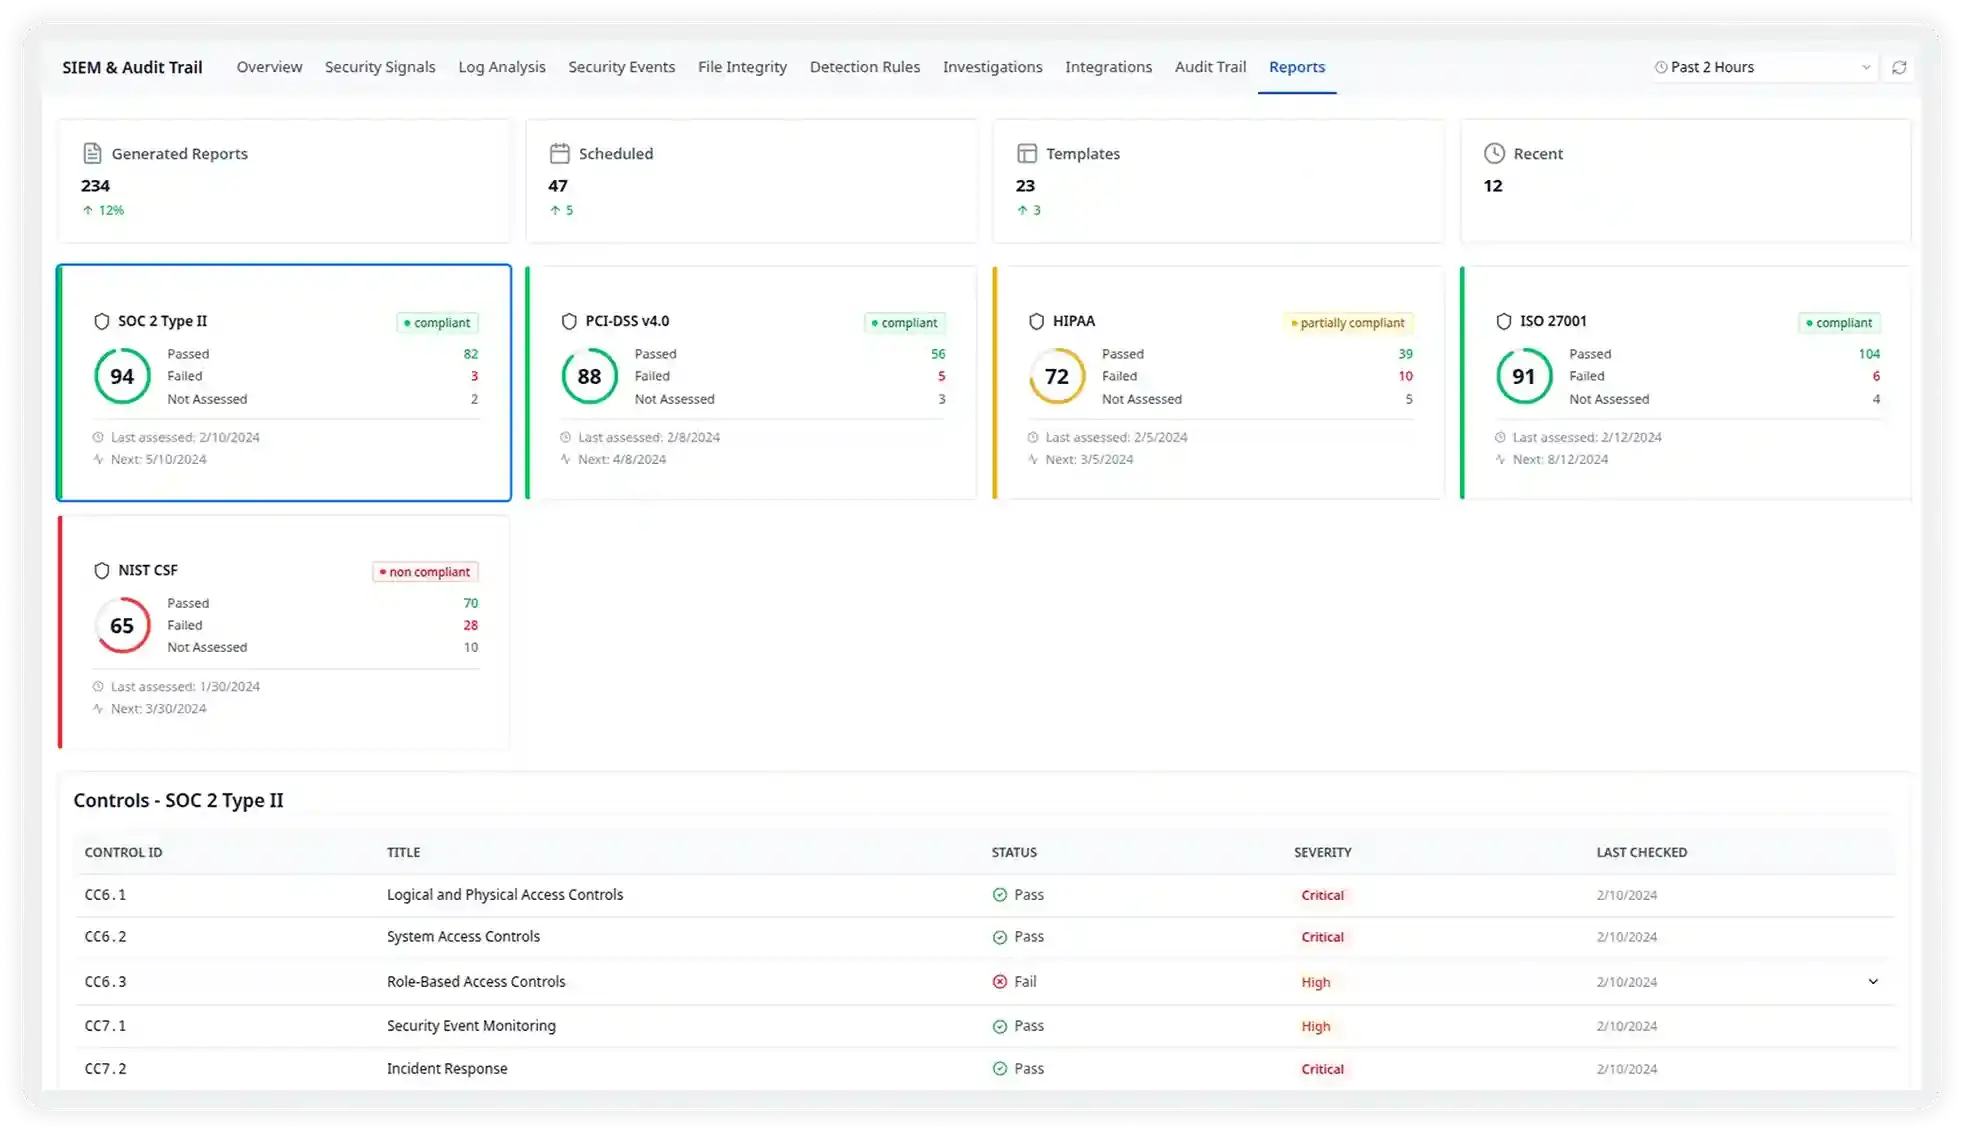
Continuous Compliance Monitoring
Automatically map security events to compliance frameworks like SOC 2, PCI-DSS, HIPAA, and ISO 27001. Atatus SIEM retains enriched telemetry for audit-ready evidence packages, so your next compliance review starts from complete data, not scattered logs.
Unified Observability for Every Engineering Team
Atatus adapts to how engineering teams work across development, operations, and reliability.
Developers
Trace requests, debug errors, and identify performance issues at the code level with clear context.
DevOps
Track deployments, monitor infrastructure impact, and understand how releases affect application stability.
Release Engineer
Measure service health, latency, and error rates to maintain reliability and reduce production risk.
Milestones that spark performance excellence
Reflections from clients who've achieved unmatched excellence through innovative strategies.
Read customer stories


