Apache HTTP Server Logs & Metrics Monitoring
Track and analyze Apache server logs in real-time, providing insights into website traffic, errors, and performance metrics for proactive troubleshooting and optimization.
Where Apache observability breaks down
Log Volume Overload
High request throughput generates massive log streams, making it difficult to isolate meaningful execution signals in real time.
Metric Context Gaps
Metrics expose numerical trends without enough execution context, forcing engineers to infer what actually caused deviations.
Slow Root Correlation
Linking errors, latency spikes, and traffic changes across logs and metrics takes time during live production incidents.
Distributed Signal Fragmentation
Logs and metrics are spread across hosts and environments, preventing a unified view of Apache behavior.
Noise Dominated Alerts
Threshold-based alerts fire frequently without clarifying whether issues are systemic or transient.
Unclear Traffic Impact
Traffic shifts and request patterns affect performance in subtle ways that raw logs fail to surface clearly.
Scale Induced Blindspots
As Apache deployments scale horizontally, visibility degrades due to inconsistent signal aggregation.
Eroding Data Trust
Repeated investigations with partial answers reduce confidence in logs and metrics during critical outages.
Complete Visibility for
Apache Logs & Metrics
Real-time observability for Apache environments that helps teams ingest logs instantly, analyze request behavior, and correlate log data with performance metrics.
Real-Time Log Ingestion
Stream Apache access and error logs in real time for immediate visibility into traffic and failures. Detect issues the moment they occur.
Structured Parsing
Automatically parse raw logs into searchable structured fields. Turn unstructured log data into actionable insights instantly.
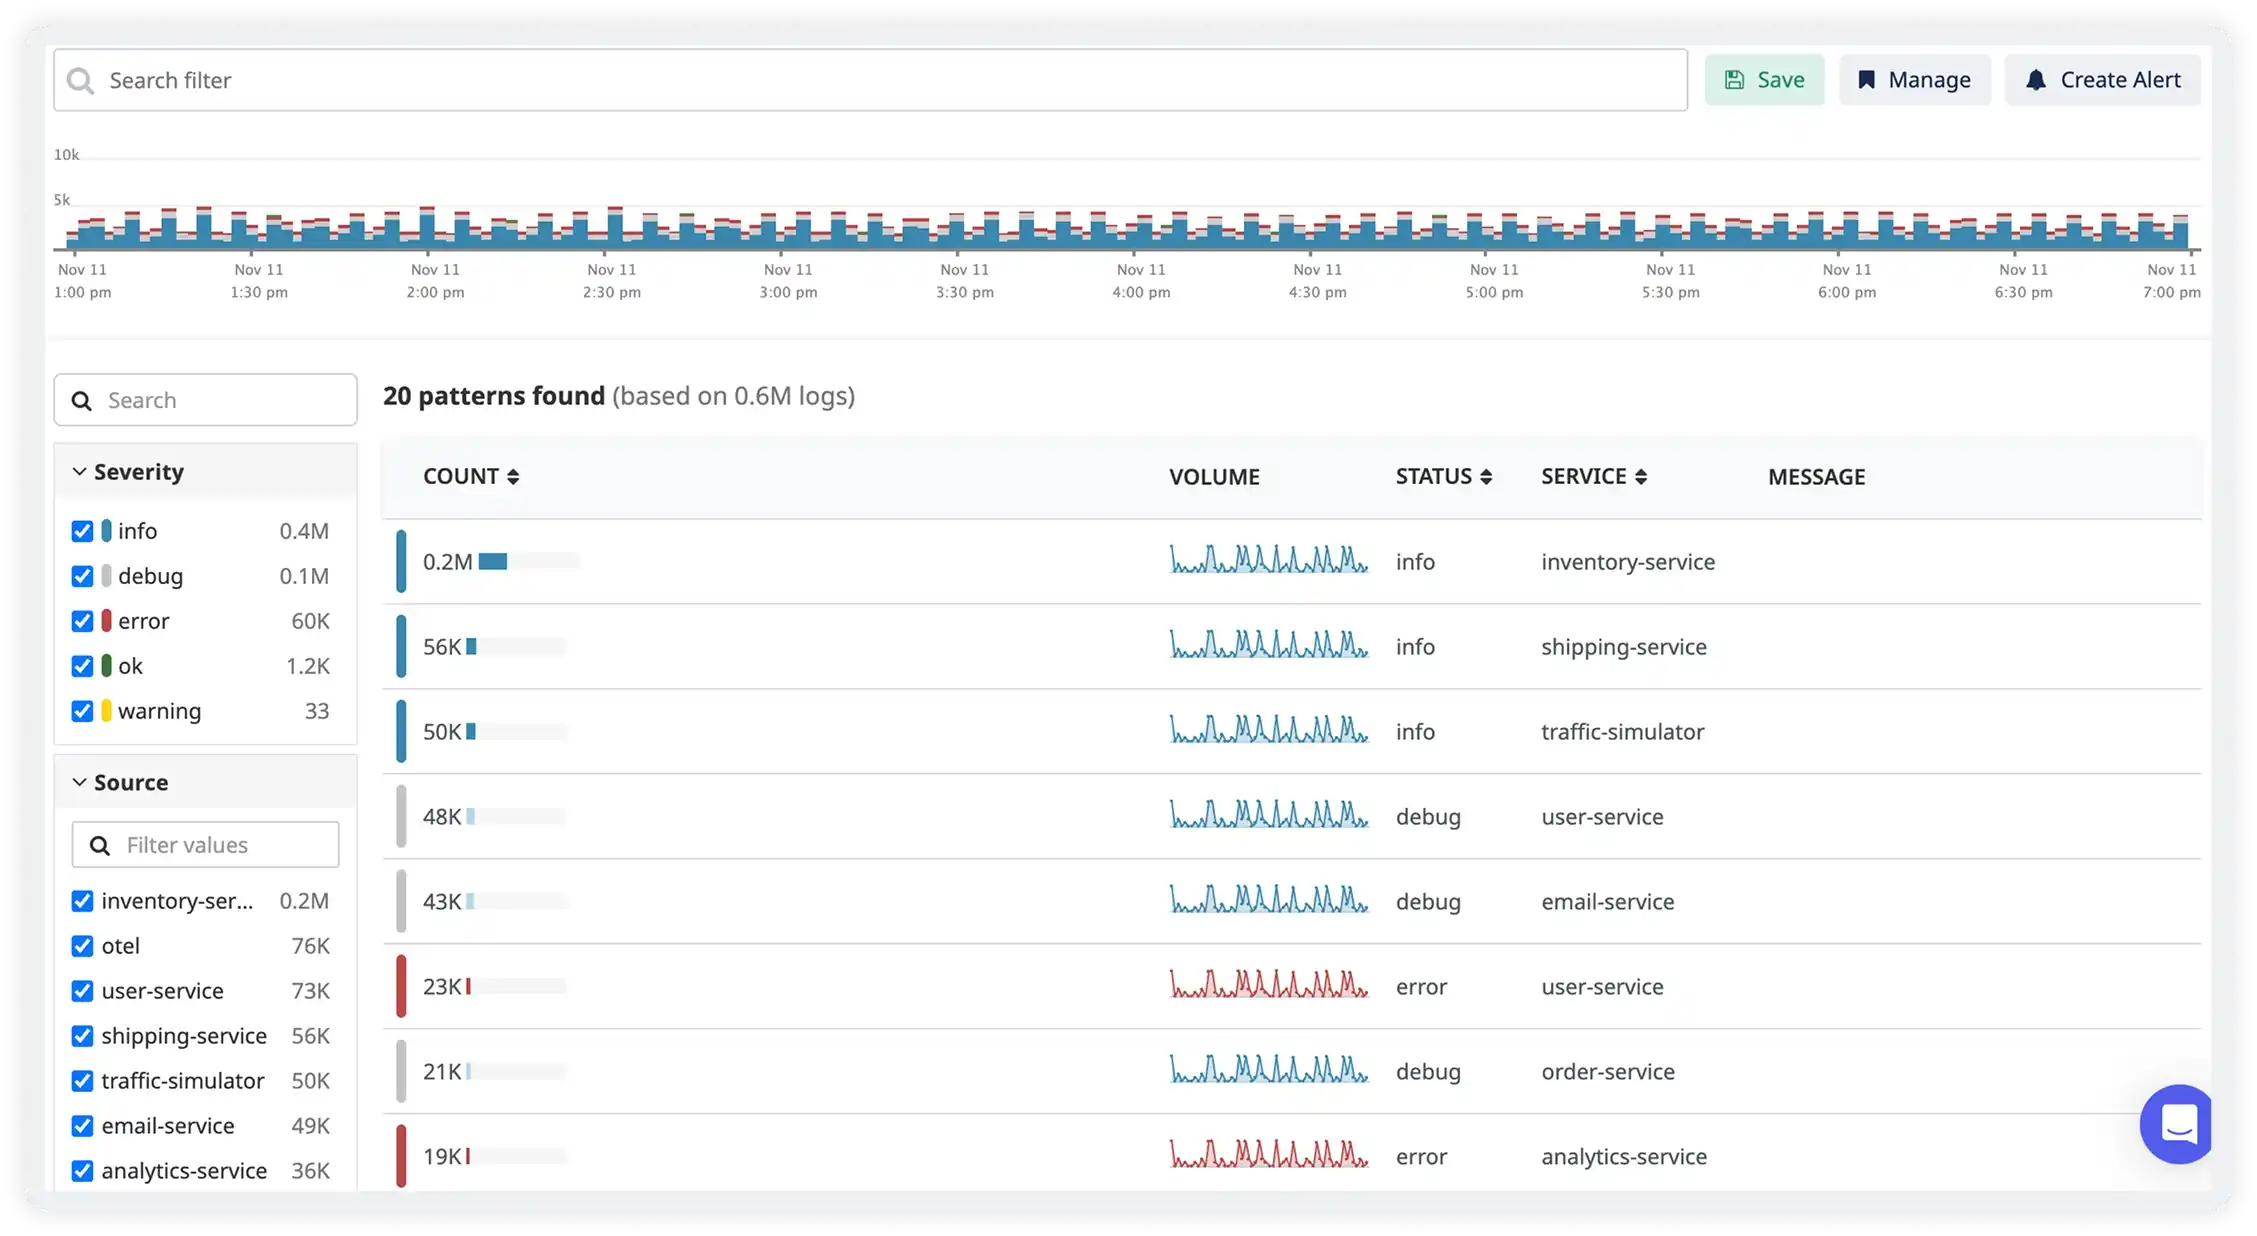
Search & Filter Views
Quickly search across logs using powerful filters by status code, endpoint, IP, or custom fields. Isolate issues in seconds.
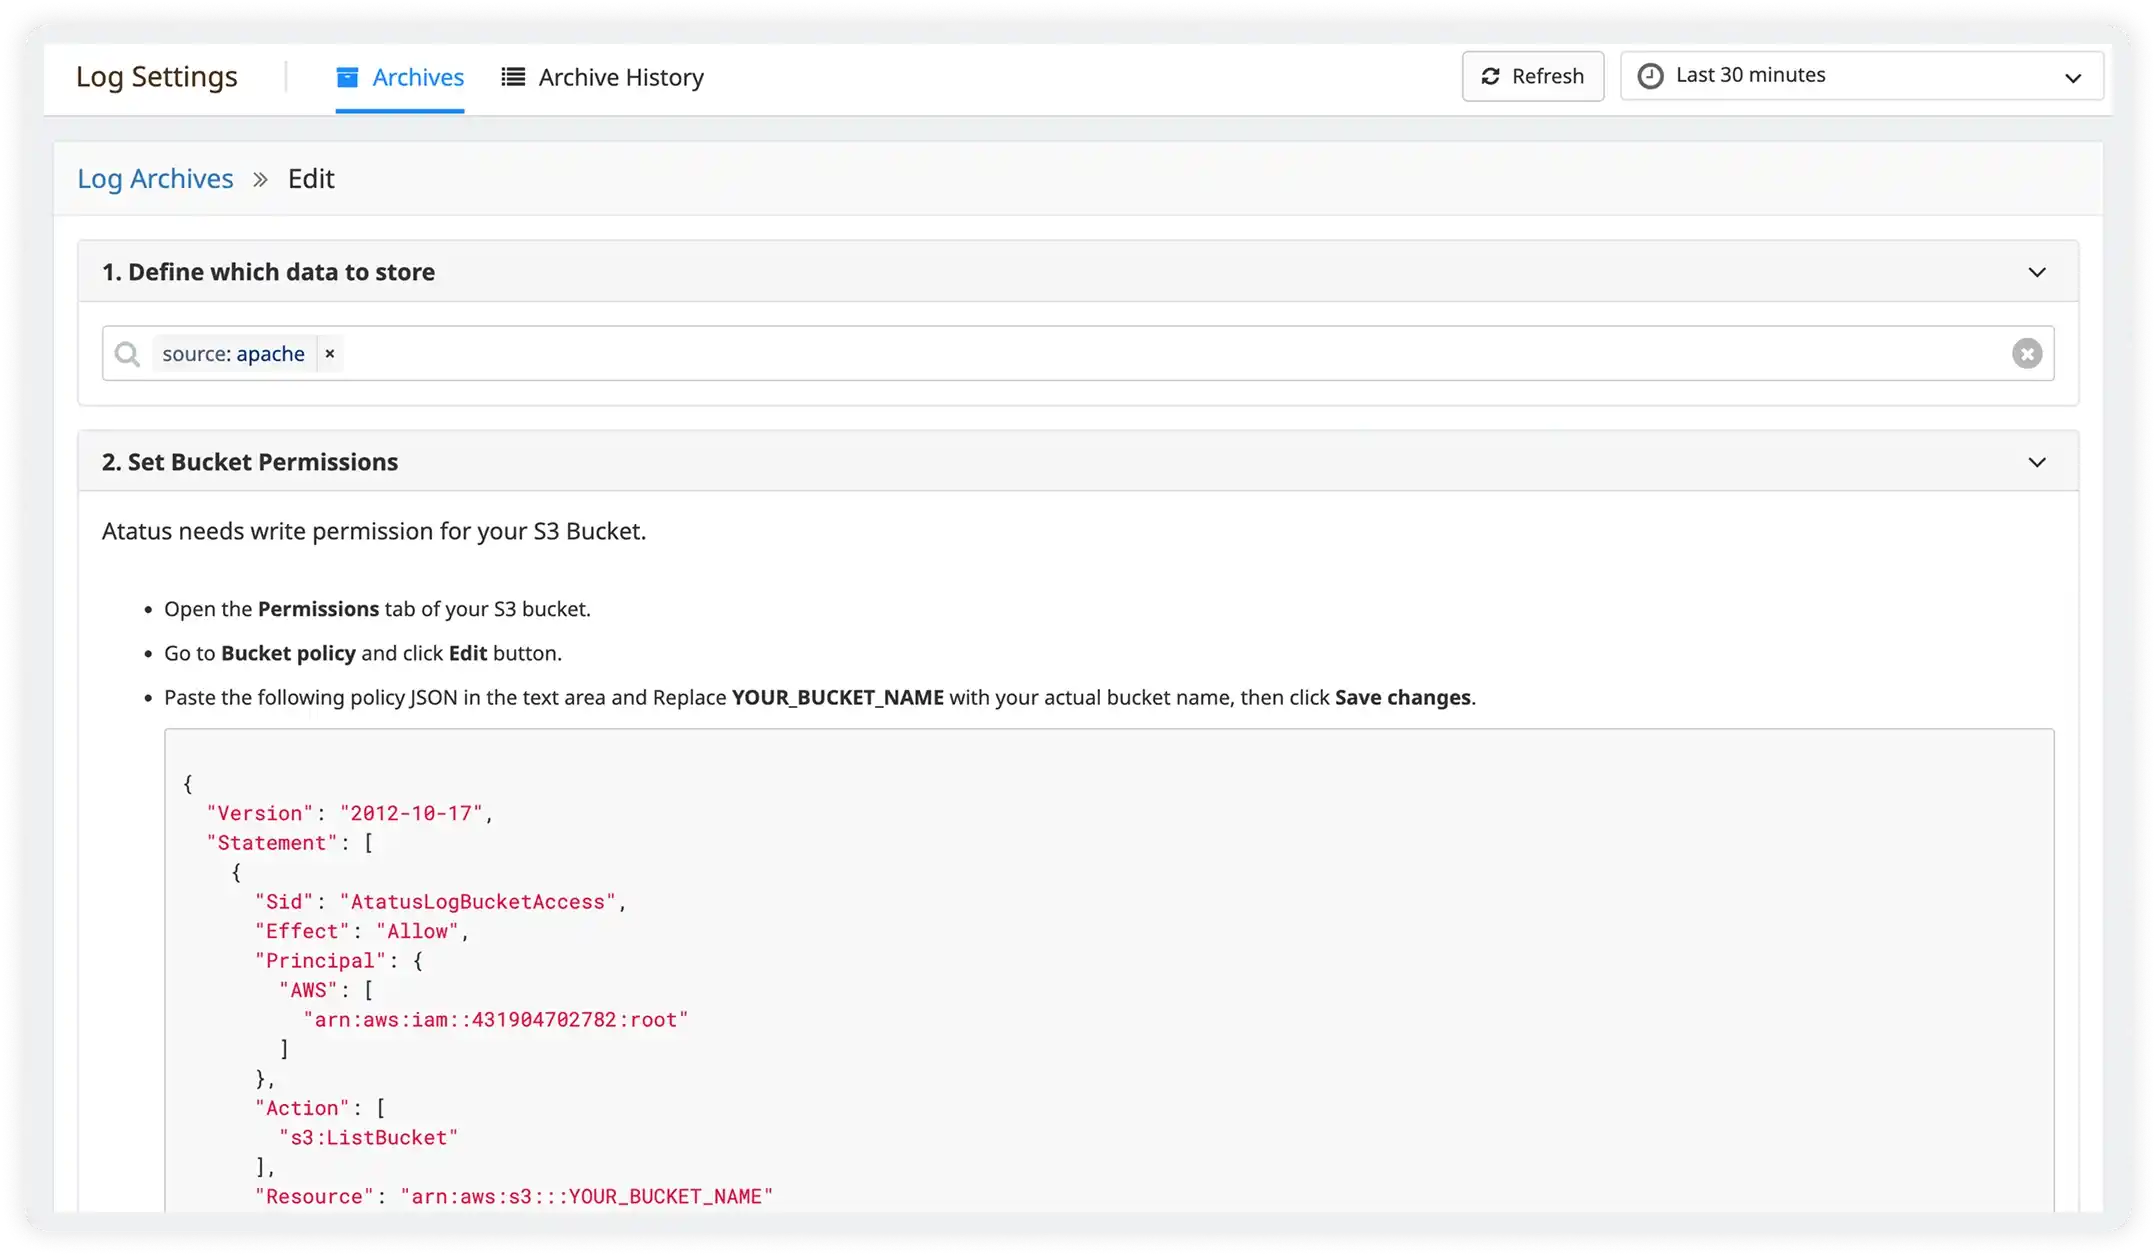
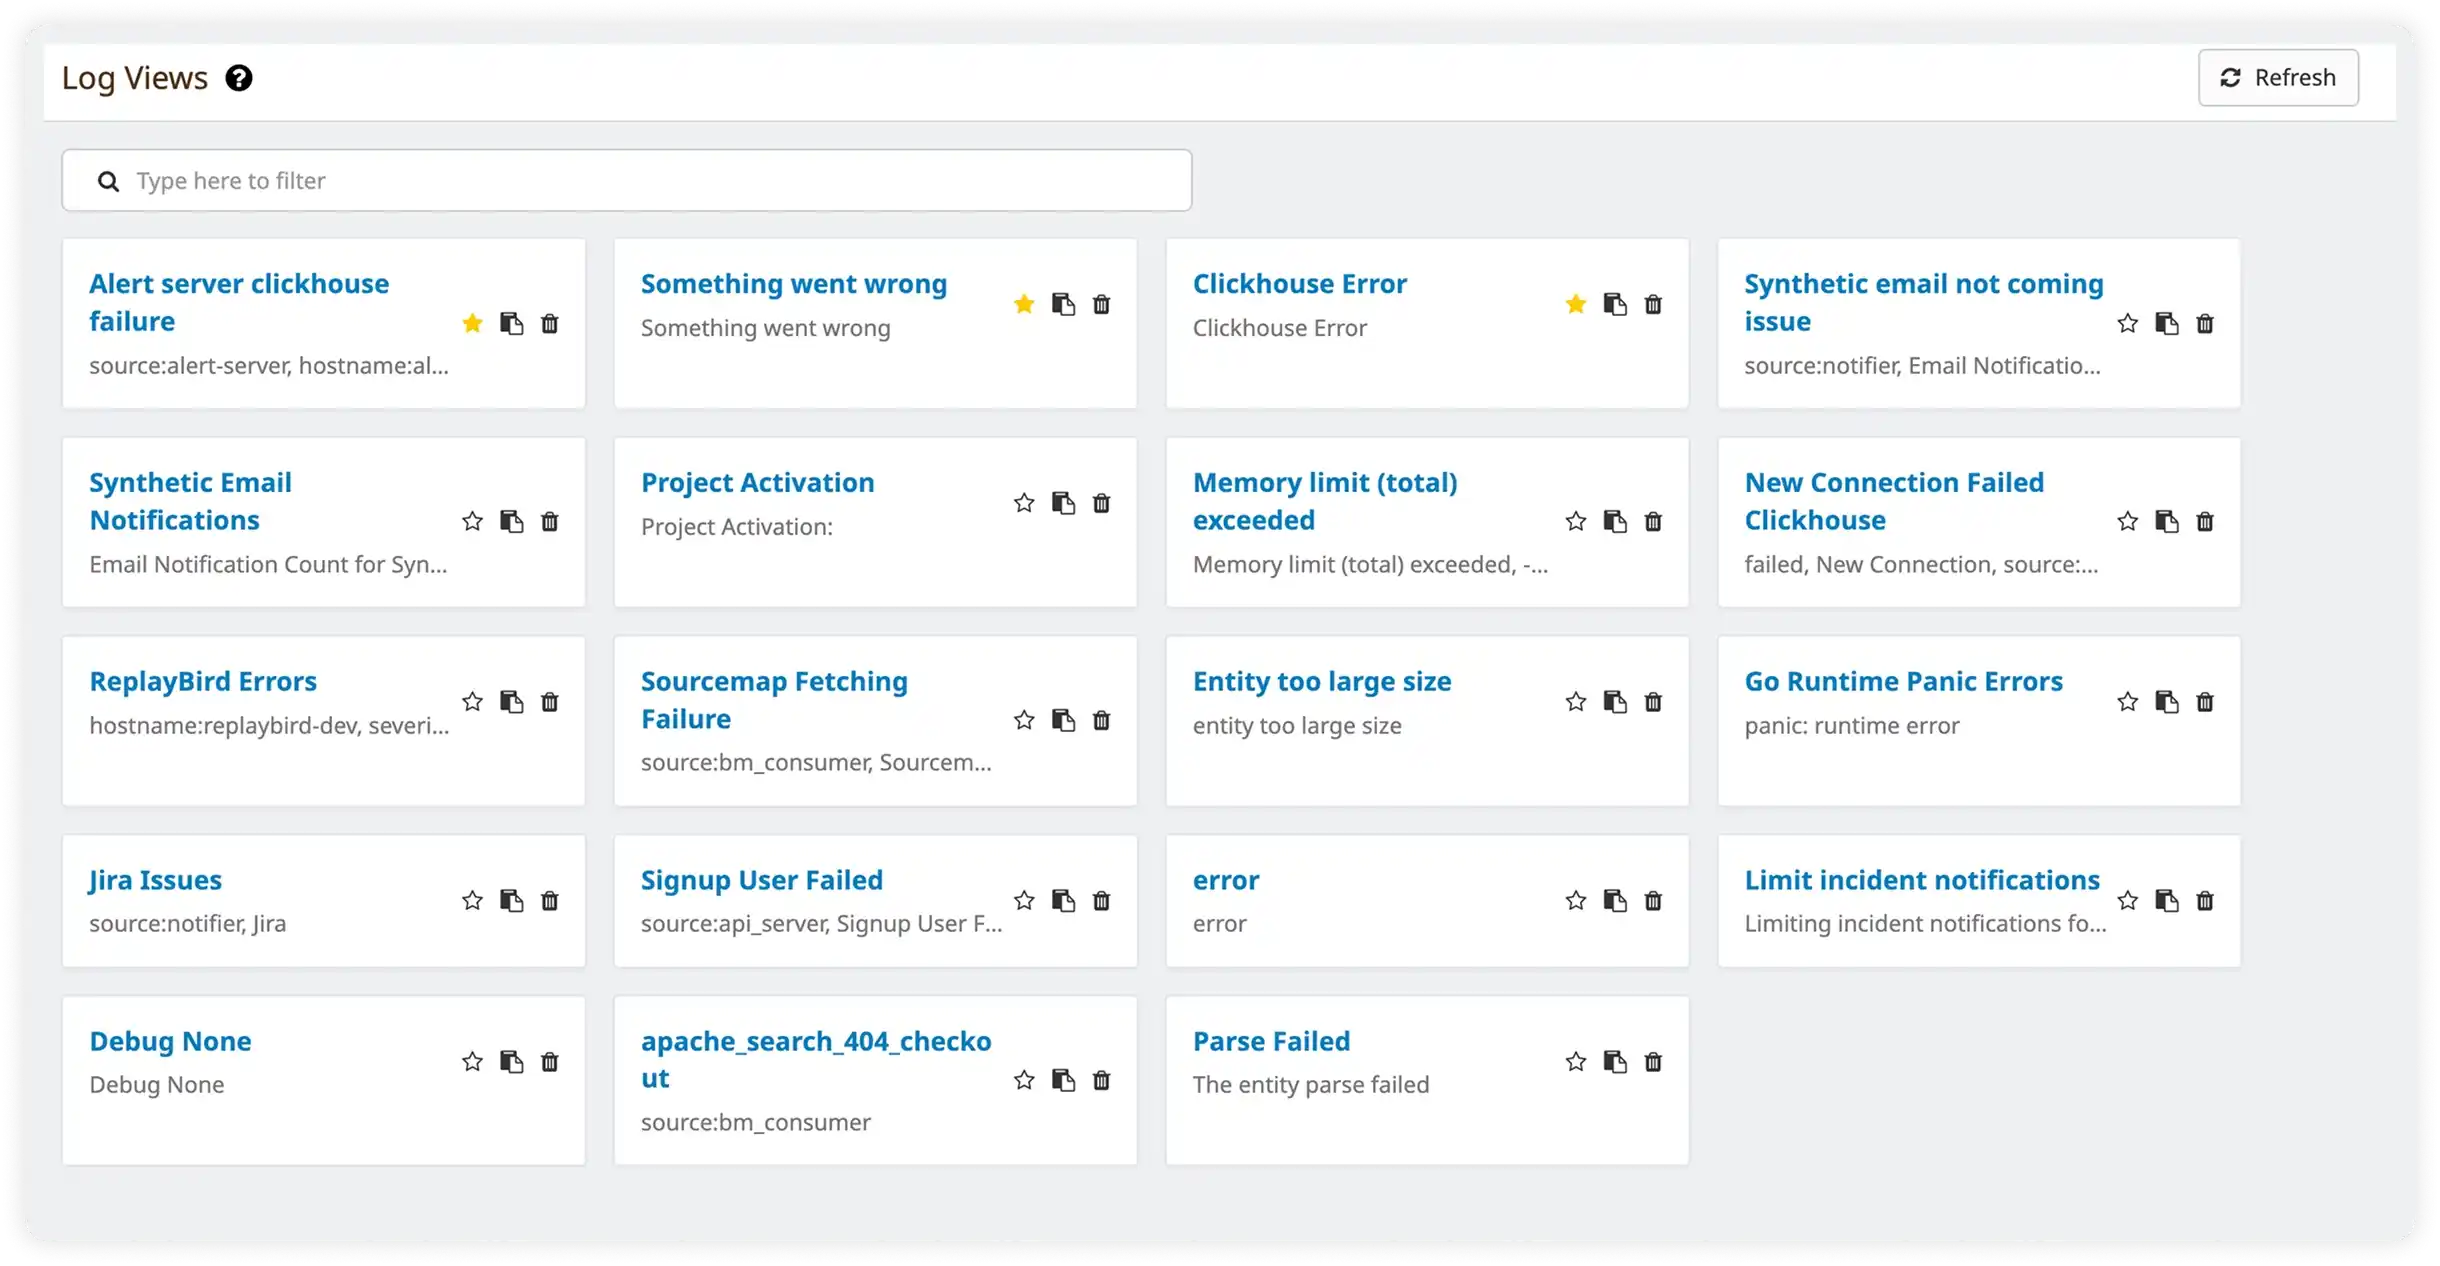
Saved Troubleshooting Contexts with Correlation With Metrics
Save log views for recurring investigations while correlating log patterns with performance metrics. Resolve incidents faster with full context.
Why Apache teams standardize on Atatus
As Apache environments grow in traffic and infrastructure footprint, raw logs and metrics alone stop explaining real production behavior. Teams standardize on Atatus to restore clarity, reduce investigative friction, and maintain confidence as scale and operational pressure increase.
Unified Signal Interpretation
Engineers reason about logs and metrics together instead of treating them as disconnected data sources.
Faster Incident Alignment
Platform, SRE, and backend teams converge on the same understanding early during production incidents.
Immediate Data Confidence
Production signals are trusted from the start of investigations, enabling faster and more decisive action.
Reduced Analysis Overhead
Engineers spend less time searching raw data and more time validating system behavior.
Predictable Debug Flow
Incident analysis follows consistent reasoning patterns even during traffic spikes and outages.
Shared Operational Context
Teams reference the same production evidence during incident reviews and postmortems.
Stability At Scale
Observability remains reliable as traffic volume and infrastructure footprint grow.
Lower On-Call Fatigue
Clear signal interpretation shortens incident duration and limits escalation loops.
Long Term Clarity
Teams maintain confidence in Apache behavior as systems evolve and scale over time.
Unified Observability for Every Engineering Team
Atatus adapts to how engineering teams work across development, operations, and reliability.
Developers
Trace requests, debug errors, and identify performance issues at the code level with clear context.
DevOps
Track deployments, monitor infrastructure impact, and understand how releases affect application stability.
Release Engineer
Measure service health, latency, and error rates to maintain reliability and reduce production risk.