Laravel Octane Monitoring
Monitor your Laravel application served by Octane to gain real-time insights into its performance and behavior, allowing you to actively observe the application's behavior and performance on the Octane server.
Monitor your Laravel application served by Octane to gain real-time insights into its performance and behavior, allowing you to actively observe the application's behavior and performance on the Octane server.
Automatically visualize end-to-end business transactions in your Laravel application served by Octane. Monitor the amount and type of failed HTTP status codes and application crash. Analyze response time to identify performance issues and Laravel errors on each and every business transaction. Understand the impact of methods and database calls that affects your customer's experience in reports.
Learn more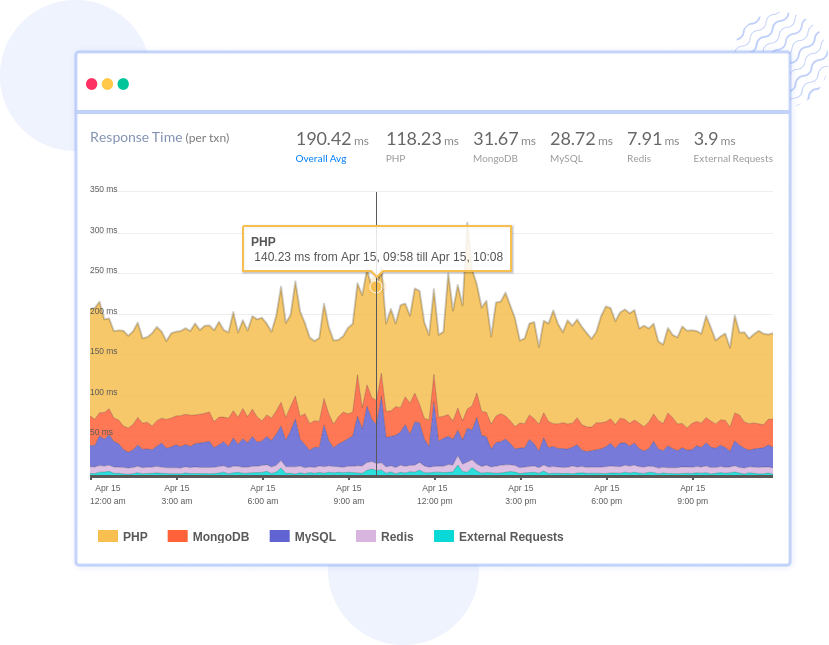
Examine all SQL and NoSQL queries used by your Laravel Octane server. Identify slow database queries and optimize query performance with database monitoring proactively. Monitor and measure third party API calls' response times and REST API failure rates along with HTTP status codes. With Laravel Octane application performance monitoring you can slice and dice performance metrics in real time—based on host, version, release stage, URL and other attributes.
Learn more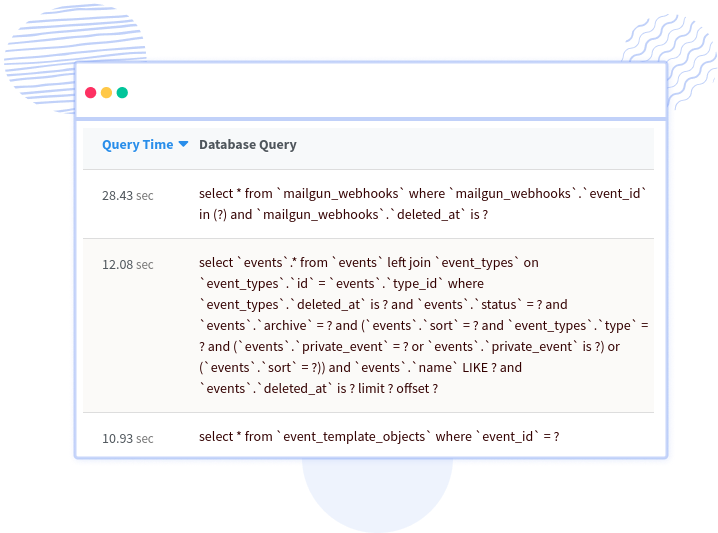
Every error is tracked using error tracking and captured with full stacktrace and exact line of source code is highlighted to make bug fixing easier. Get all the essential data such as class, message, URL, request agent, version etc to fix the Laravel Octane exceptions and errors. Laravel Octane monitoring identifies buggy API or third party services by investigating API failure rates and application crashes. Get alerts for application errors and exceptions via Email, Slack, PagerDuty, or using webhooks.
Learn more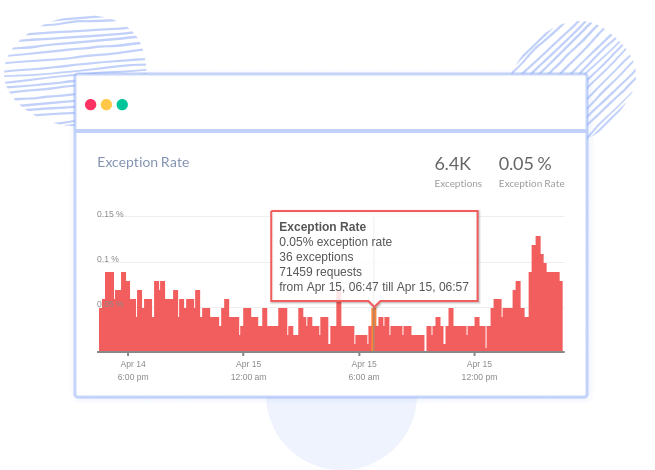
Quickly view the highest Laravel HTTP failures, including those optimized with Octane, and get each request's information along with custom data to identify the root cause of the failures. See the breakdown of the API failures based on HTTP status codes and the end-users having the highest impact.
Learn more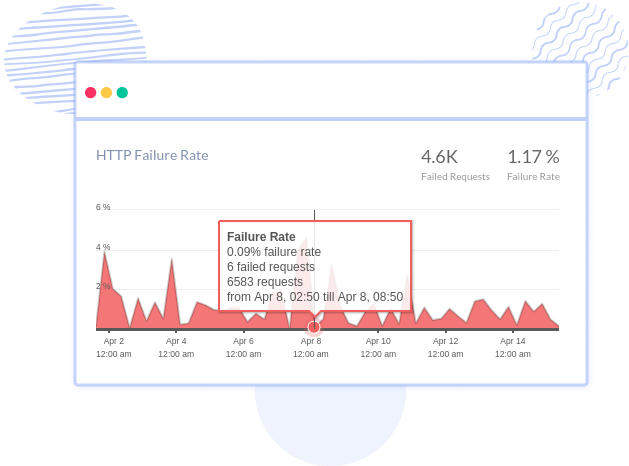
Break down slow requests by time spent in code blocks, database queries, external services, templates, message queues and much more. View logs, infrastructure metrics, VM metrics in context with the original request with the real-time laravel Octane performance metrics.
Learn more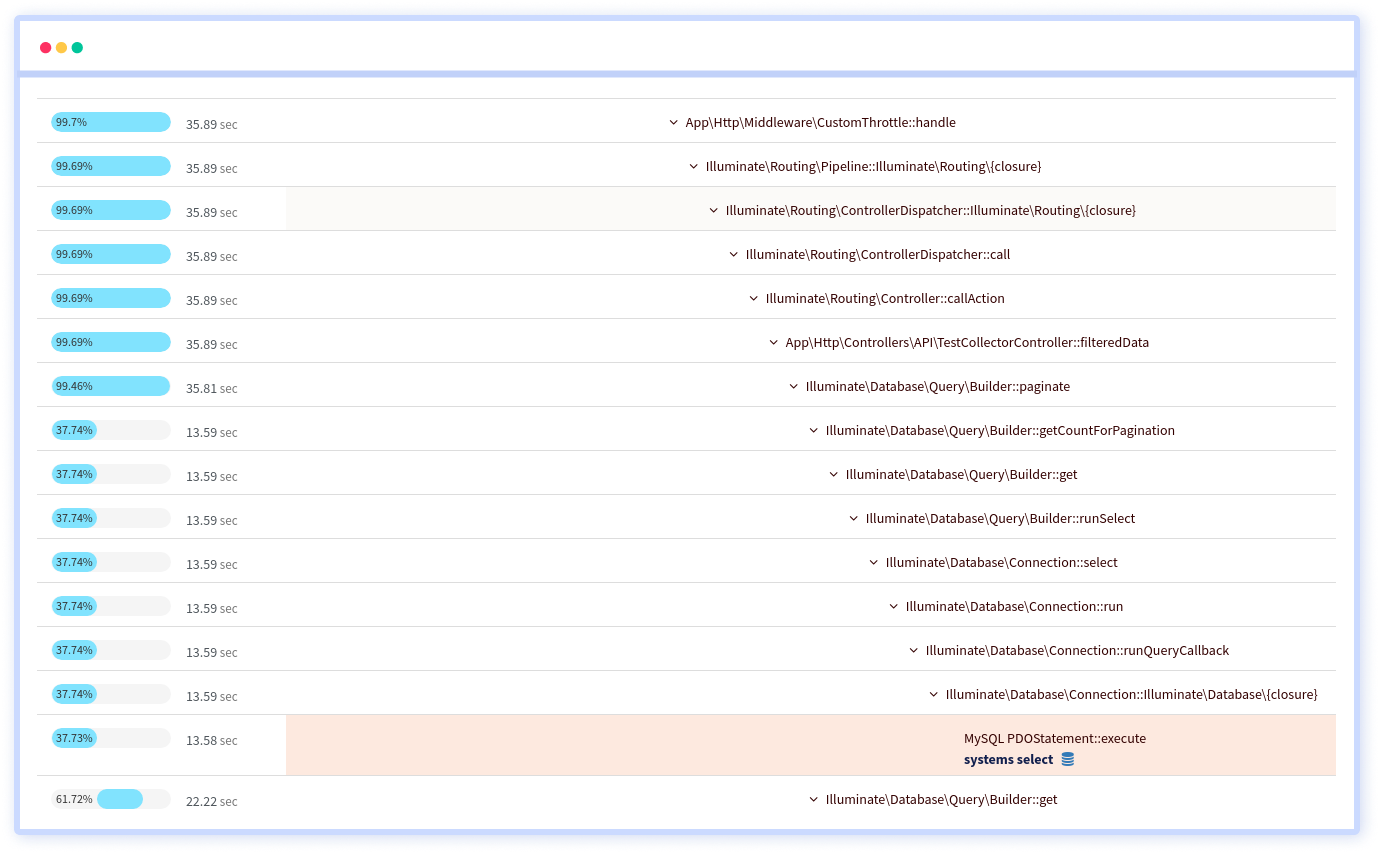
Atatus captures all requests to your Laravel Octane applications without requiring you to change your source code. Get a clear picture of how all your methods, database statements and external requests are affecting your user's experience.
Try it free. No credit card required. Instant set-up.
Best APM Monitoring tool
— S Herman Kiefus, DevOps Admin, Compass
Monitor Zend, Symfony, Yii, WordPress, Magento, Drupal and more. Gain insights into your Laravel Octane performance, enhancing transaction flow and speeding up error resolution.
Visualize end-to-end traces across your stack, ensuring that you catch every Laravel Octane error, performance issue, or bottleneck before it affects users.
Pinpoint and resolve slow database queries and eliminate performance bottlenecks impacting your Laravel Octane application's responsiveness, leading to faster response times
Get alerted to potential library vulnerabilities, preventing security risks before they affect your customers or compliance.
Centralize all your Laravel Octane logs in one place, and quickly identify the root cause of issues using advanced filtering, pattern detection, and log pipelines.
Set up and track custom metrics that align with your app's KPIs to ensure you're monitoring exactly what matters most for your success.
Explore request-level analysis, including stdout APM logs, to understand execution times, bottlenecks, and areas that need optimization.
Correlate your app’s Laravel Octane APM metrics with server health to get a complete picture of your application’s performance and infrastructure dependencies.
Receive real-time alerts for Laravel Octane app performance degradations and critical issues. Take immediate action to prevent downtime and optimize user experiences.
Laravel Octane is a tool developed to boost the performance of Laravel applications by utilizing Swoole, an asynchronous programming framework for PHP. Octane allows Laravel applications to handle more concurrent requests efficiently, resulting in improved performance and scalability.
Monitoring is crucial for Laravel applications served on Octane to ensure optimal performance, detect errors, troubleshoot issues, and gain insights into application behavior under the Octane server environment.
Key metrics to monitor include:
To monitor your Laravel Octane application with Atatus, you need to integrate the Atatus PHP agent into your application and configure it to collect relevant performance metrics. Check out the Laravel octane documentation for more.
Atatus enables you to set up alerts based on predefined thresholds for key performance metrics such as response time, error rate, throughput, and resource utilization. This helps you proactively identify and address performance issues.
Yes, Atatus provides distributed tracing capabilities that enable end-to-end visibility into transactions spanning multiple services and components within a microservices architecture. By instrumenting communication between Octane instances and other services, you can trace requests across the entire application stack and analyze performance bottlenecks.
While the Atatus PHP agent incurs some performance overhead due to instrumentation and data collection, it is generally minimal and well-optimized. However, you should monitor resource usage and performance impact, especially in high-traffic or resource-constrained environments, to ensure that the monitoring overhead remains acceptable.
Feel assured as we maintain rigorous security protocols, ensuring the safety of your data with every interaction


Avail Atatus features for 14 days free-trial. No credit card required. Instant set-up.
 +1-415-800-4104


